3% Doesn't Matter

- Everyone is talking about 3% on Treasury yields as a line in the sand
- The most common long-term yield chart being passed around is flawed.
- A look at the correct Treasury yield channels.
Let's first look at how we got here...
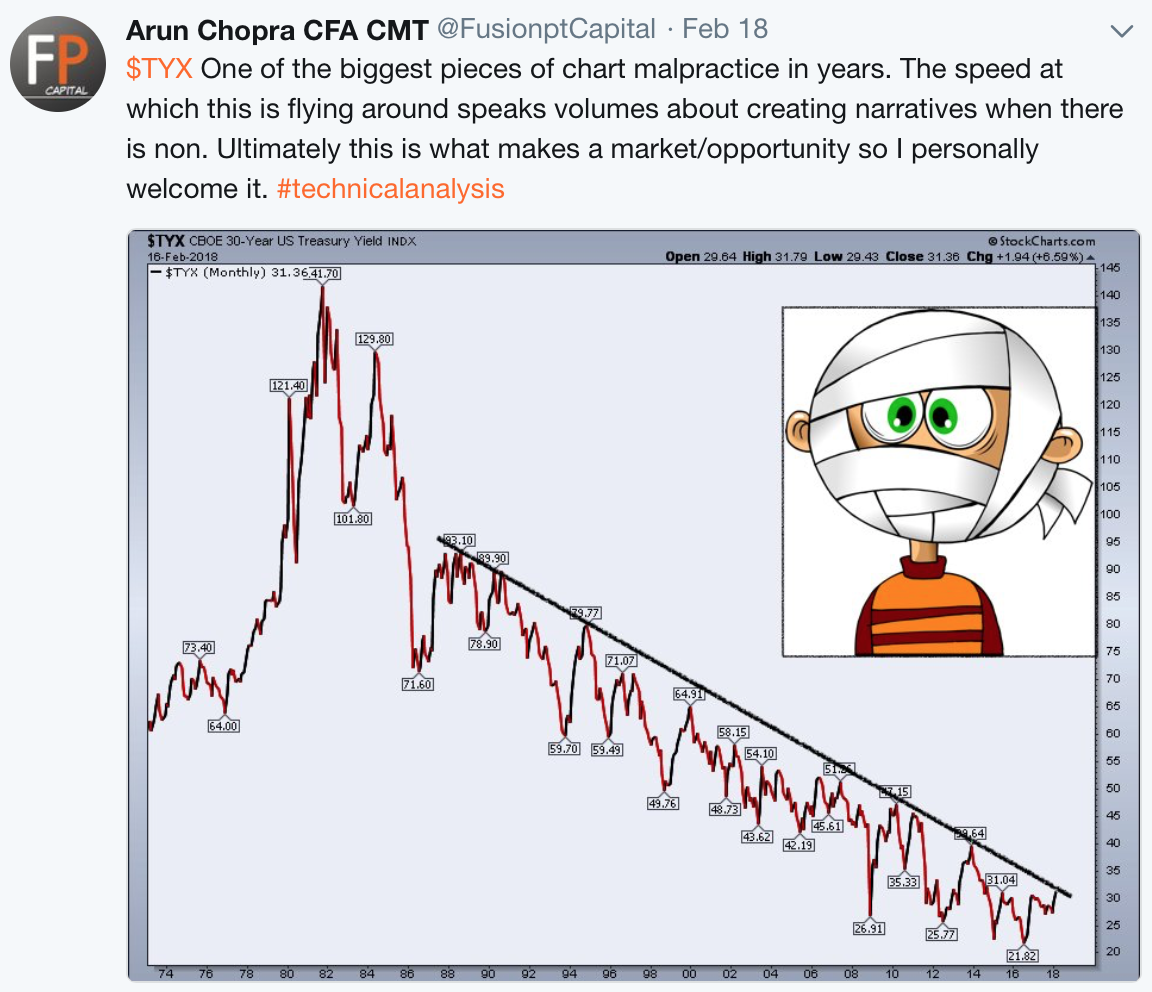
Chart Malpractice
The most common chart being published on tens looks like the following 3 (please note they are not my charts; they are simply others I have come across in a variety of mediums). I have purposefully blurred out any contributor information as that isn't my game. This is about trying to be on the right side of the market, period.
Chart 1. The 3% resistance Level
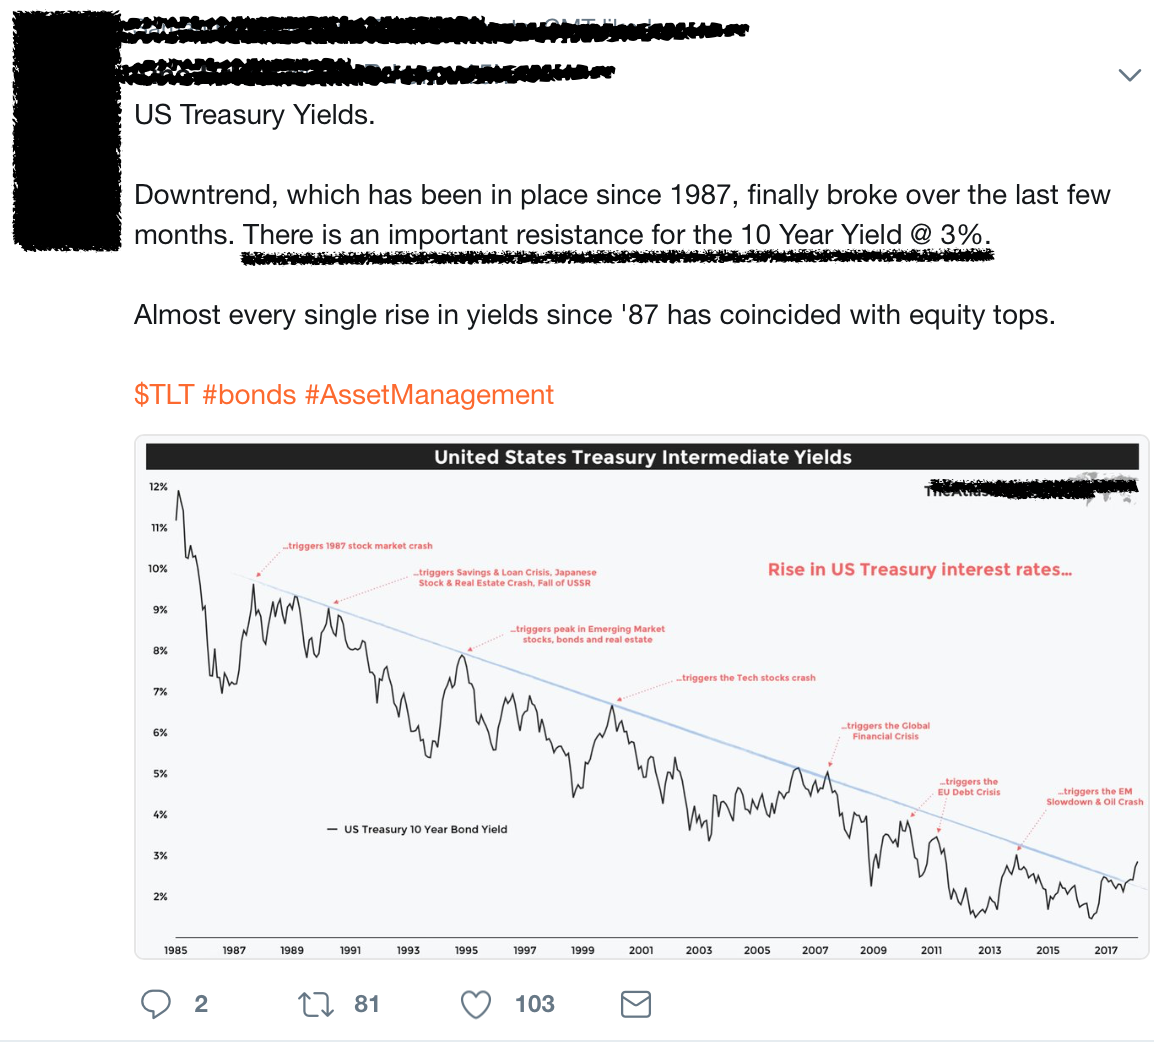
This is the market's new bear 'hope'. 'Rising rates are about to break a 35-year downtrend and 'crash everything'. For that to happen however, the chart has to match the narrative, and I suspect that is why we keep seeing this version of the yield chart so often.
Chart 2. The 3% resistance level 'bursts the energy bubble'
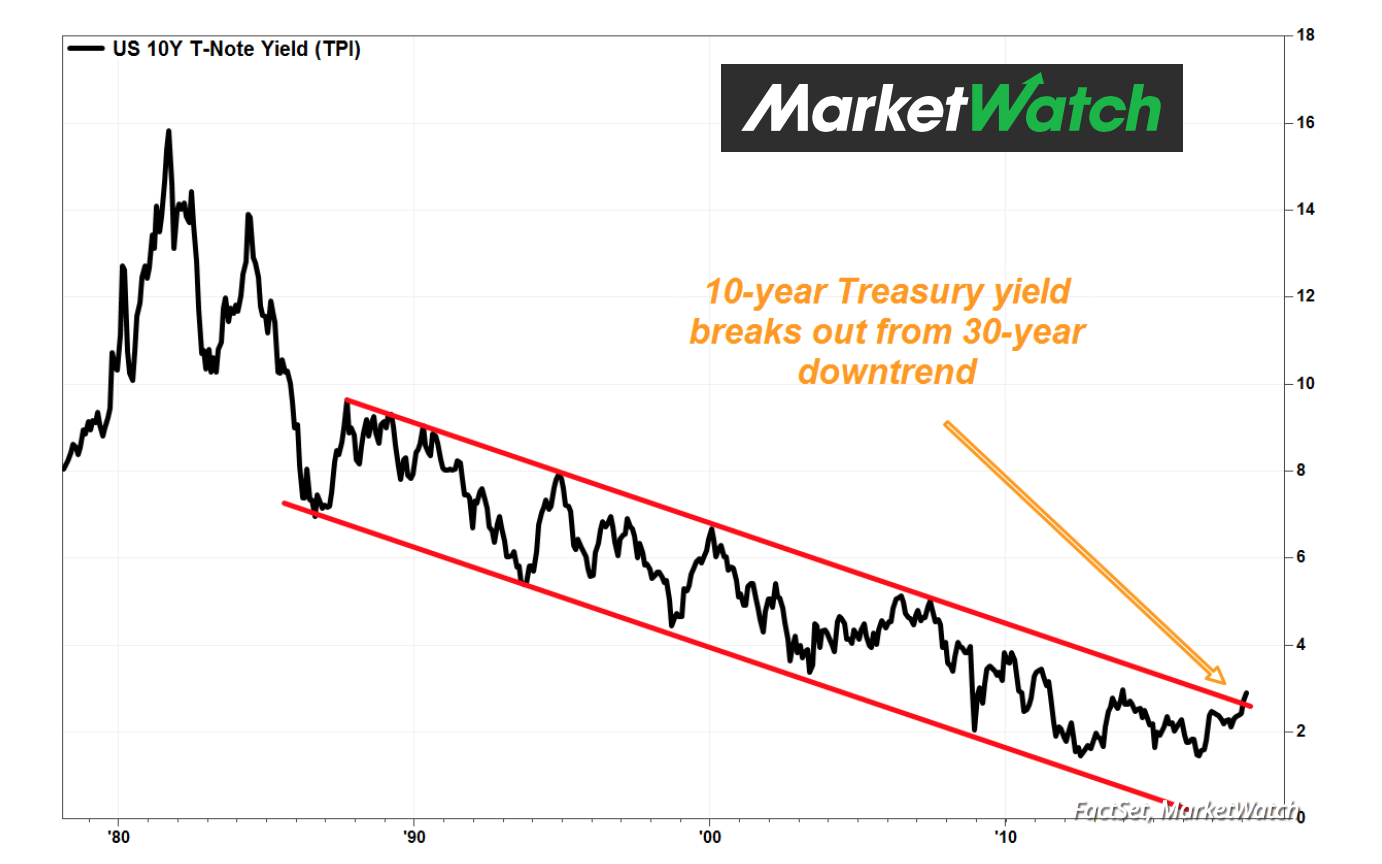
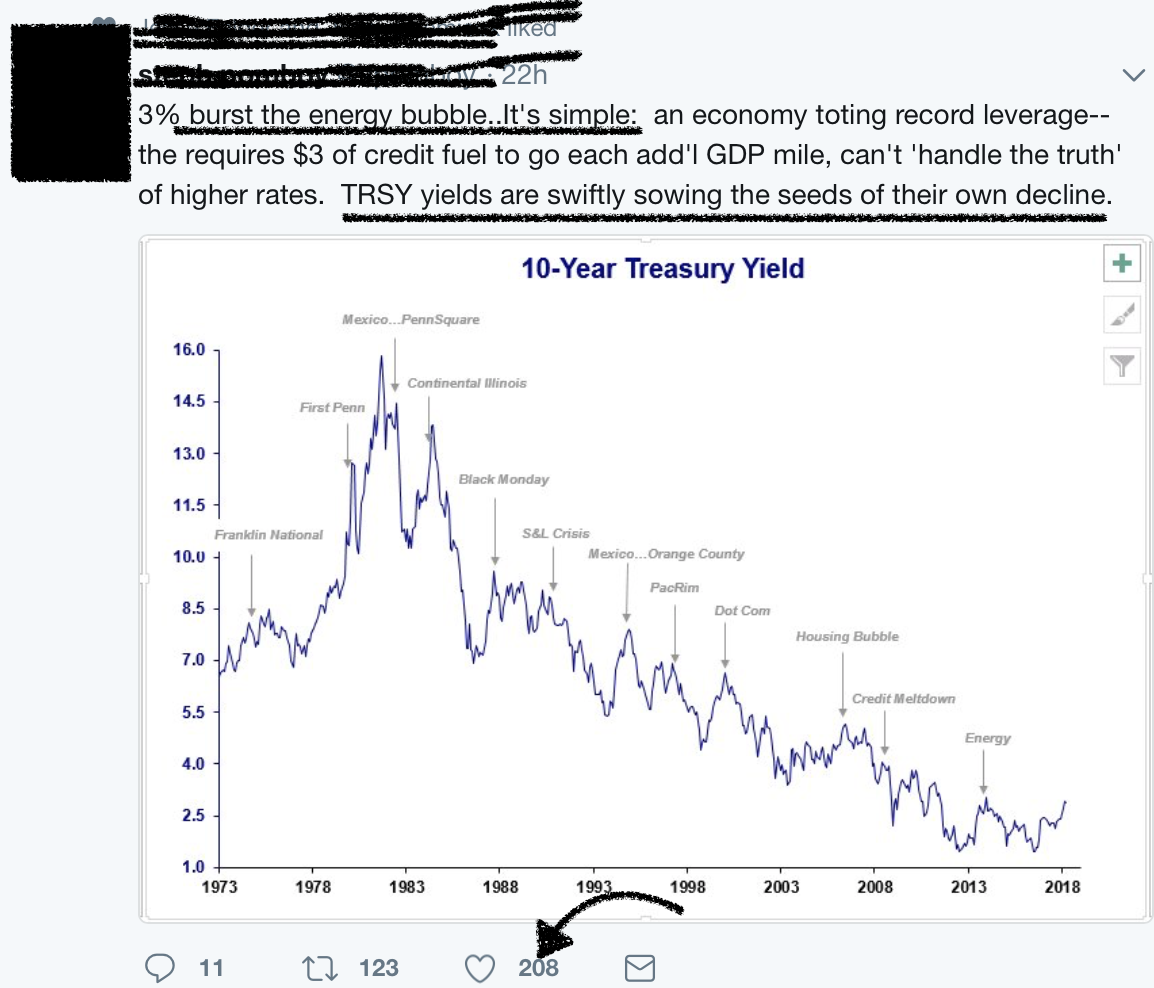 You literally cannot escape this view of yields. The other day I had 3 in a row on my Twitter feed. Of critical importance is the bearish tone to every post, as well as the number of overall likes, etc. MarketWatch even jumped in the ring, saying the breakout was already under way.
Chart 3. The 3% already broken out!
The above is now driving the narrative and being echoed across media outlets and formats. Again, I have absolutely nothing against any of these participants. I am simply having a behavioral conversation. Since 2008 everyone is on the lookout for the next 'game ender'. Some want to be the next Michael Burry, some are fear mongering, some are just pissed off and late to the party, and others are genuinely concerned in this pressure filled environment (investing post massive fed reflation, valuations, and now policy shifts-yes it is very difficult). Either way it's been the perfect storm for 'crash callers' for almost a decade now. Yields are the latest part of that game.
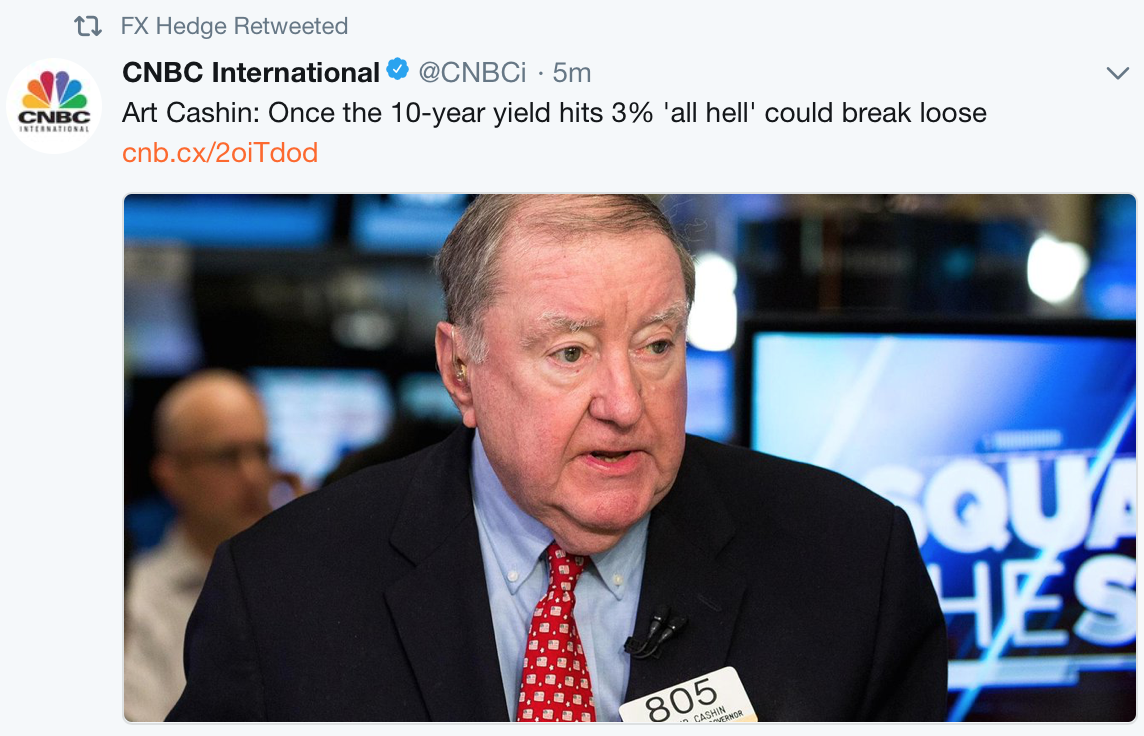
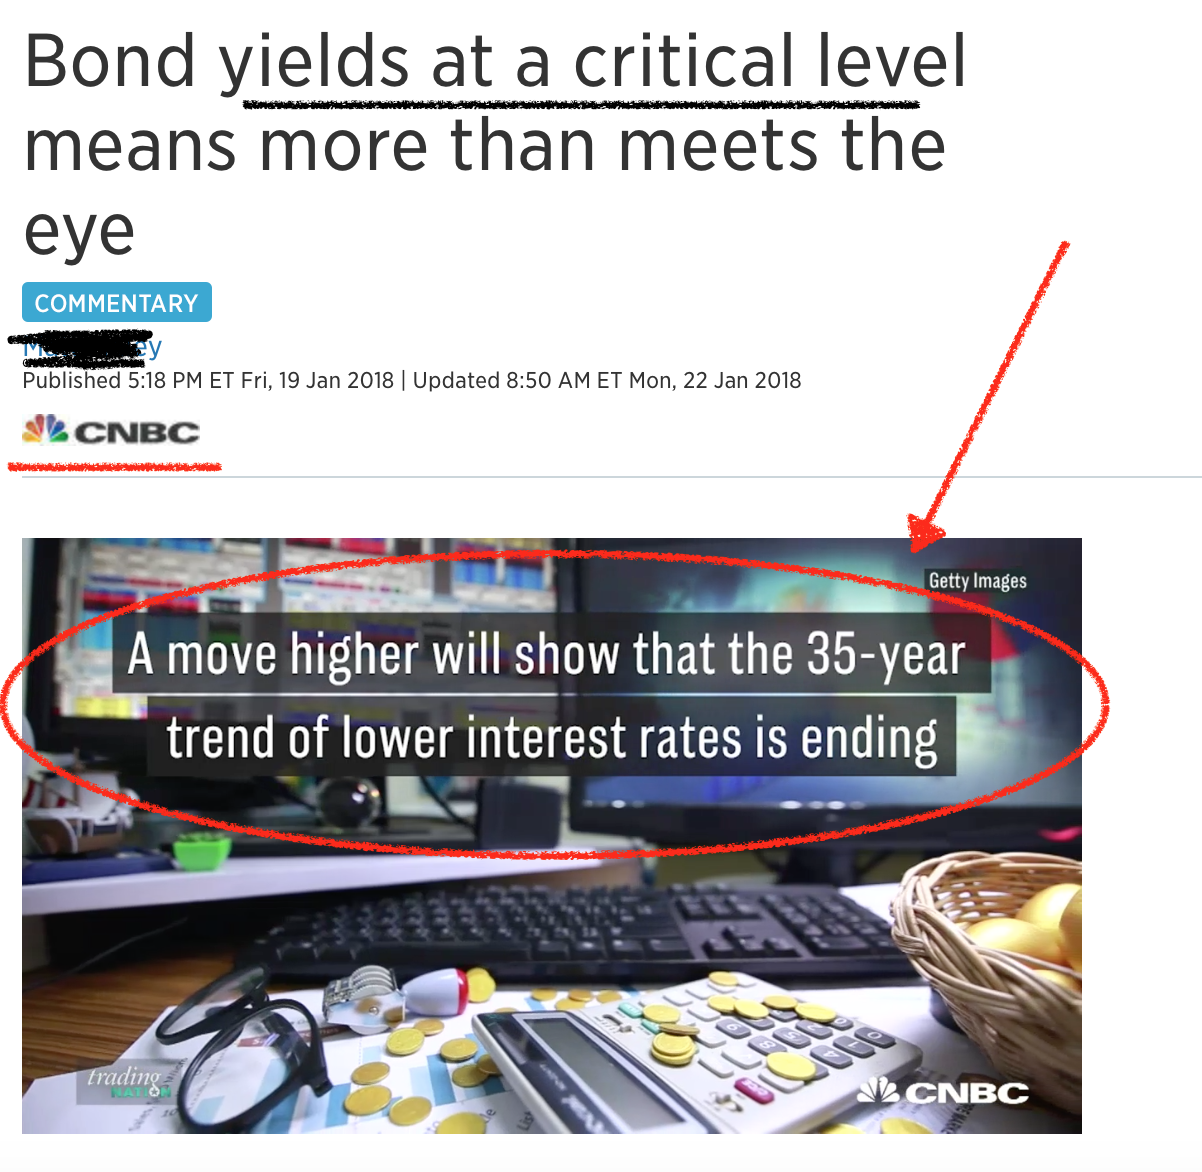
CNBC naturally has jumped in the mix as well. Simply note this same idea that the '35-year trendline' is under threat.
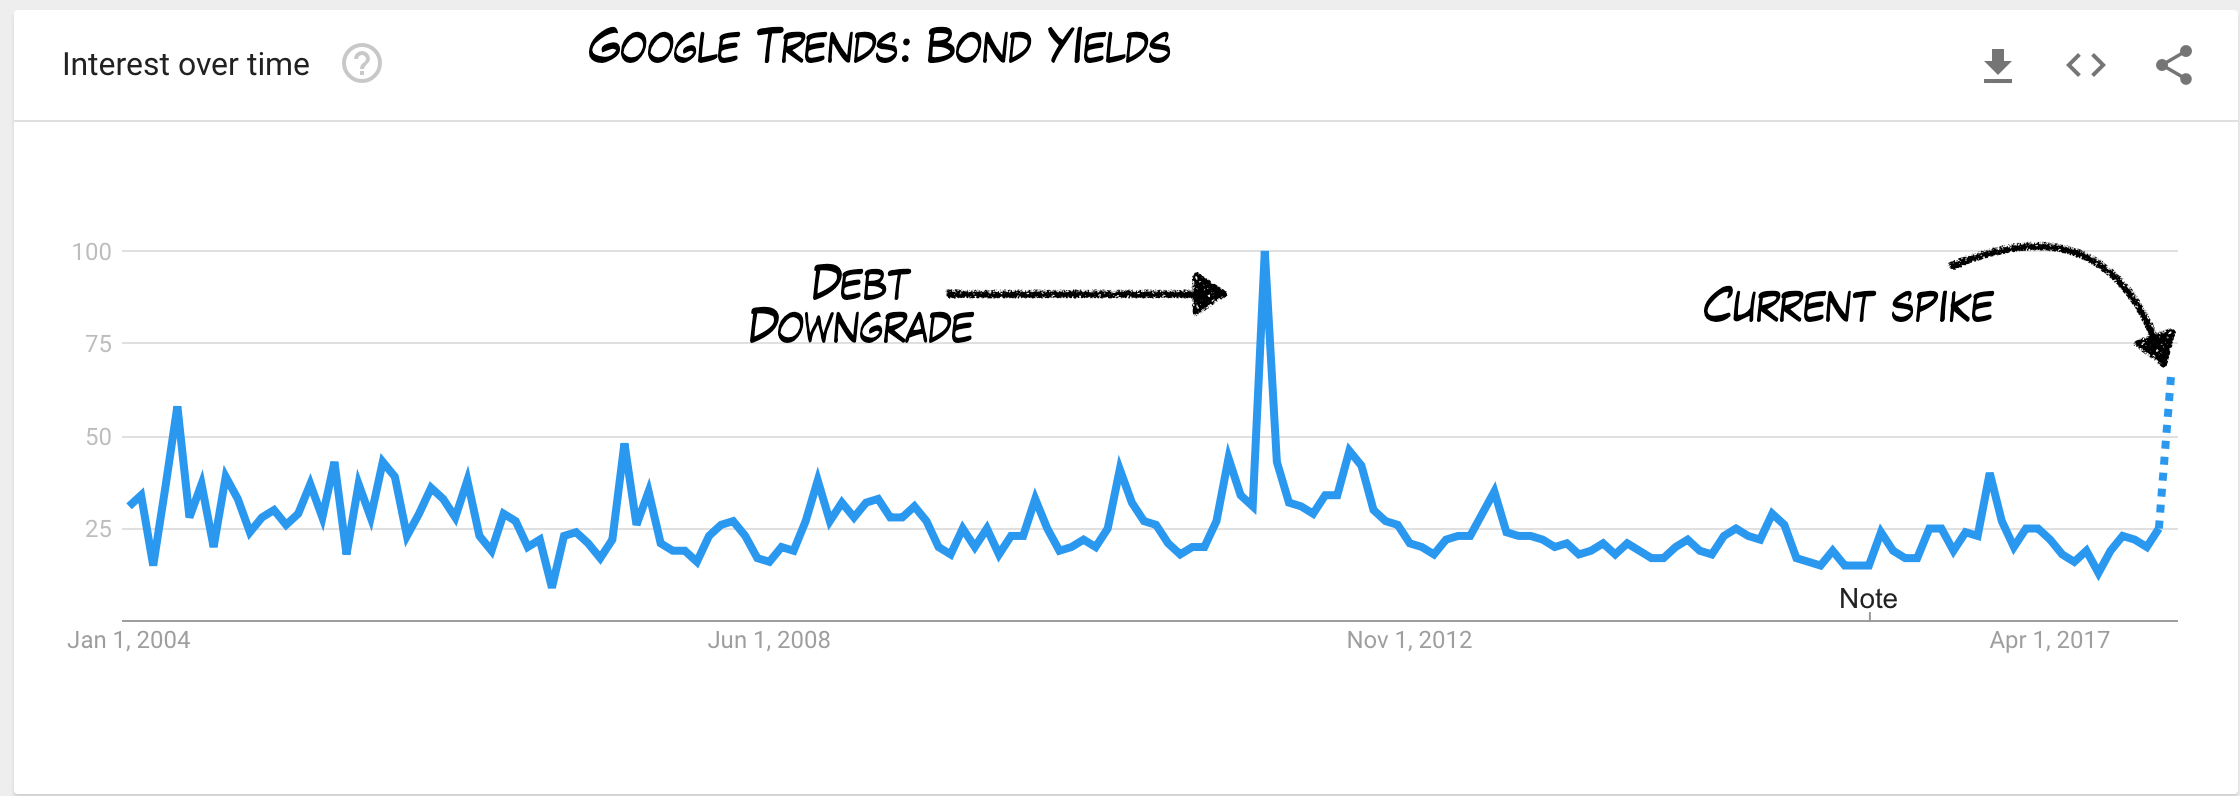
 It's gotten so bad that Google Trends registered the highest reading since 2011 for the search 'bond yields'.
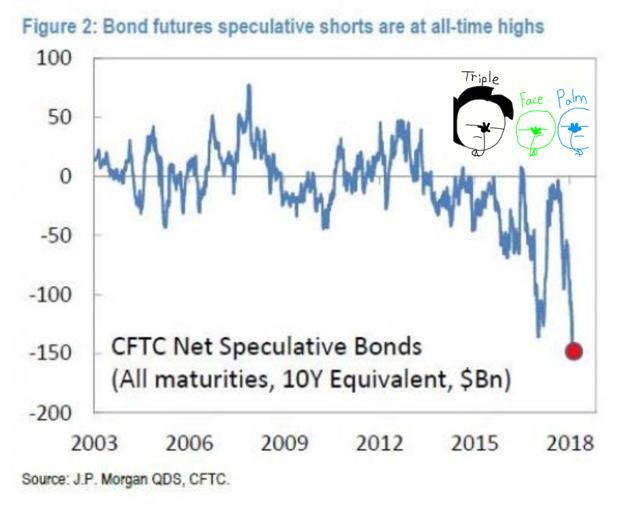
And even better, everyone has decided to... you guessed it, short bonds! If only markets were so easy.
 For the sake of my own credibility, this latest rollover in bond prices and rise in yields has been part of my outlook since summer of last year. Here was my Treasury short in the back half of last year, when yields were still around 2.4%. Since this video's release we have seen the major rally to where we are today.
Groupthink
But back to the current market. Groupthink is very common in financial markets. One example was in the beginning of 2017, when everyone was sure the dollar was heading higher. Who can forget what followed?
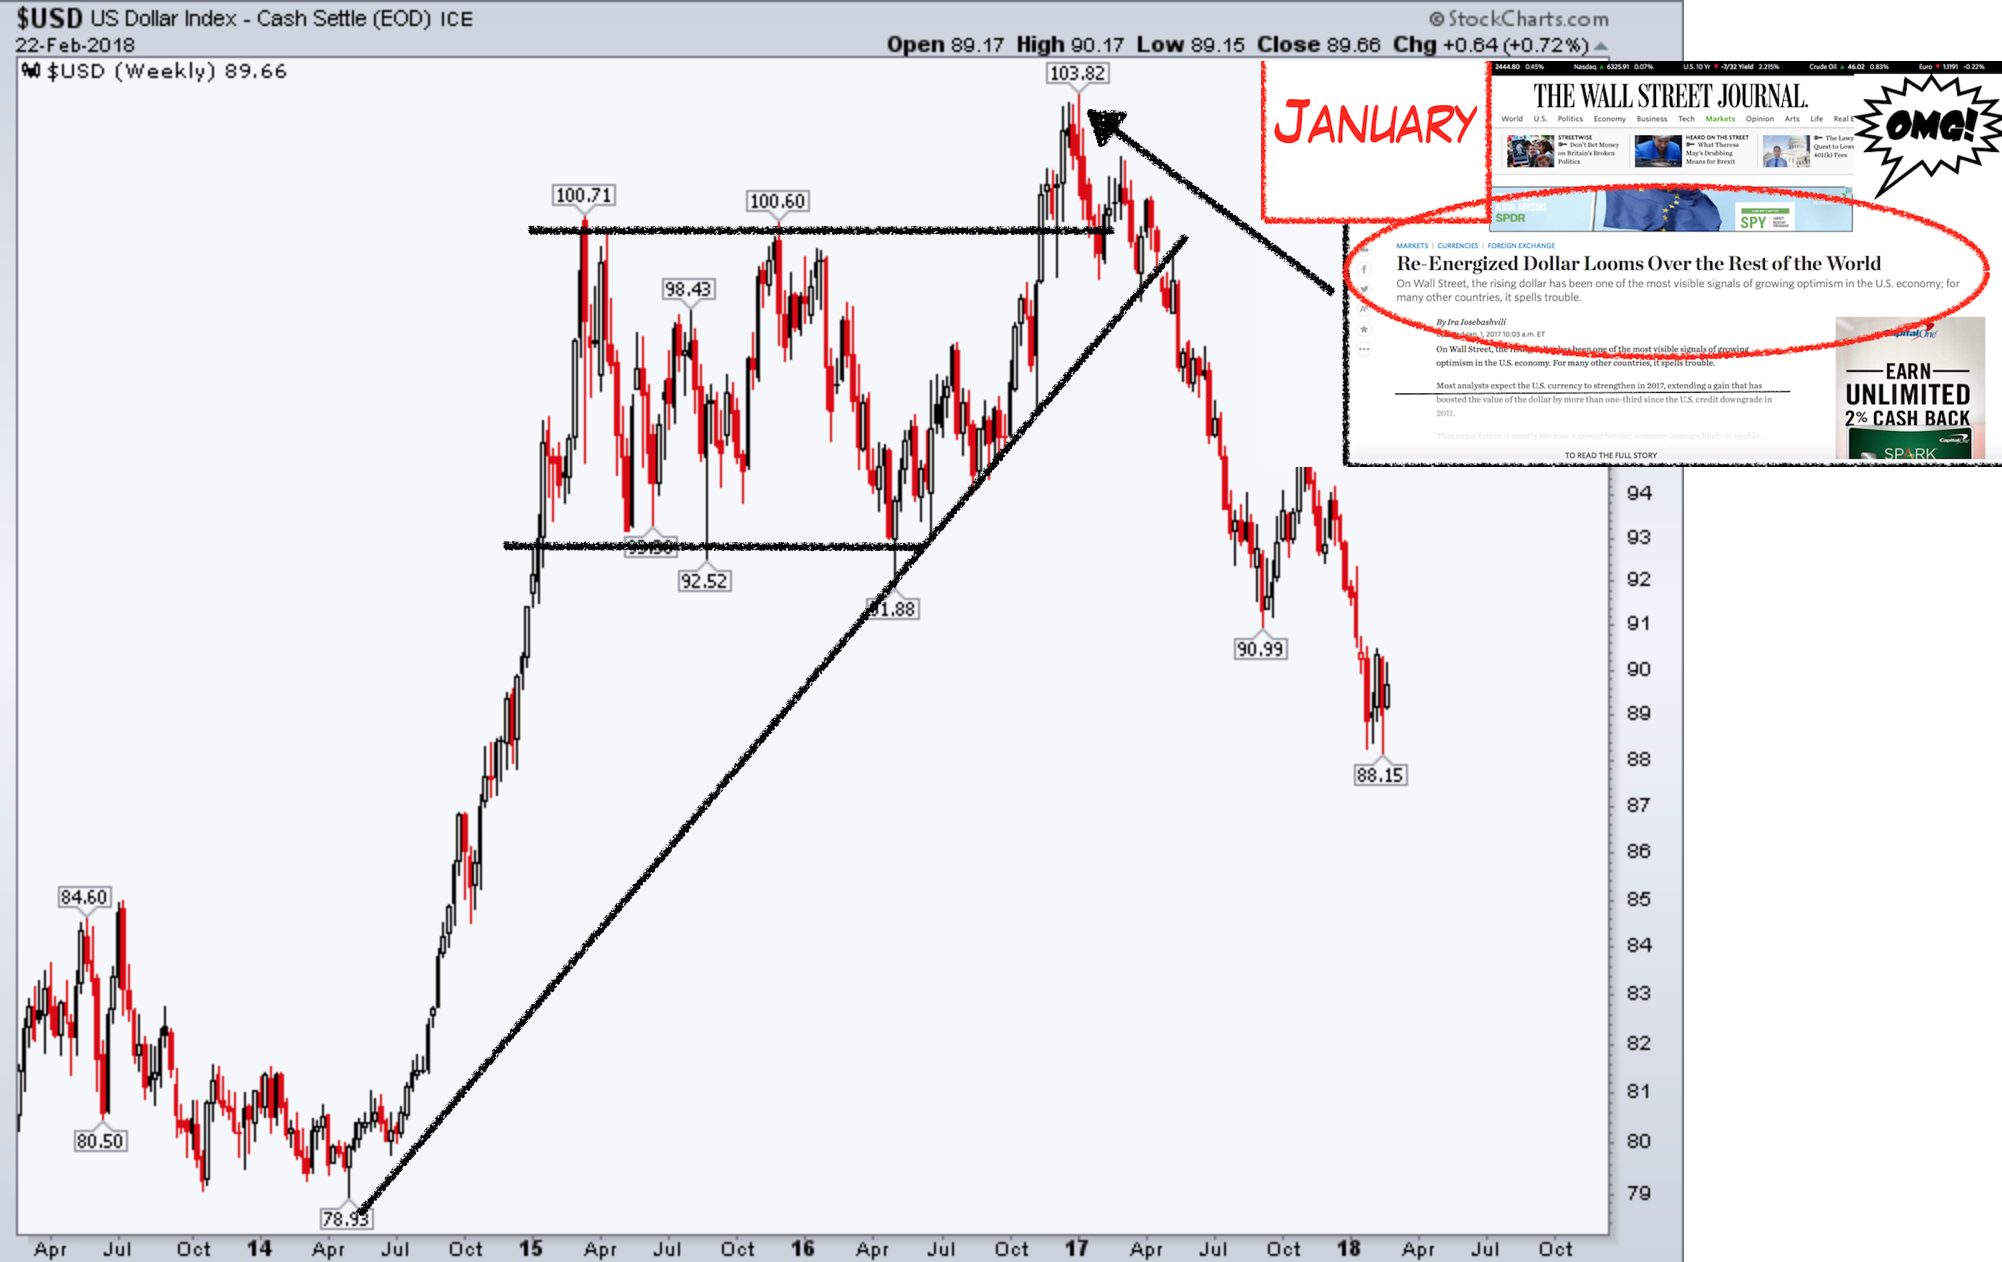
The above is just one example of a common occurrence (wrong headline, crowded trade, etc.) but behaviorally it is critical to understand, particularly in macro.
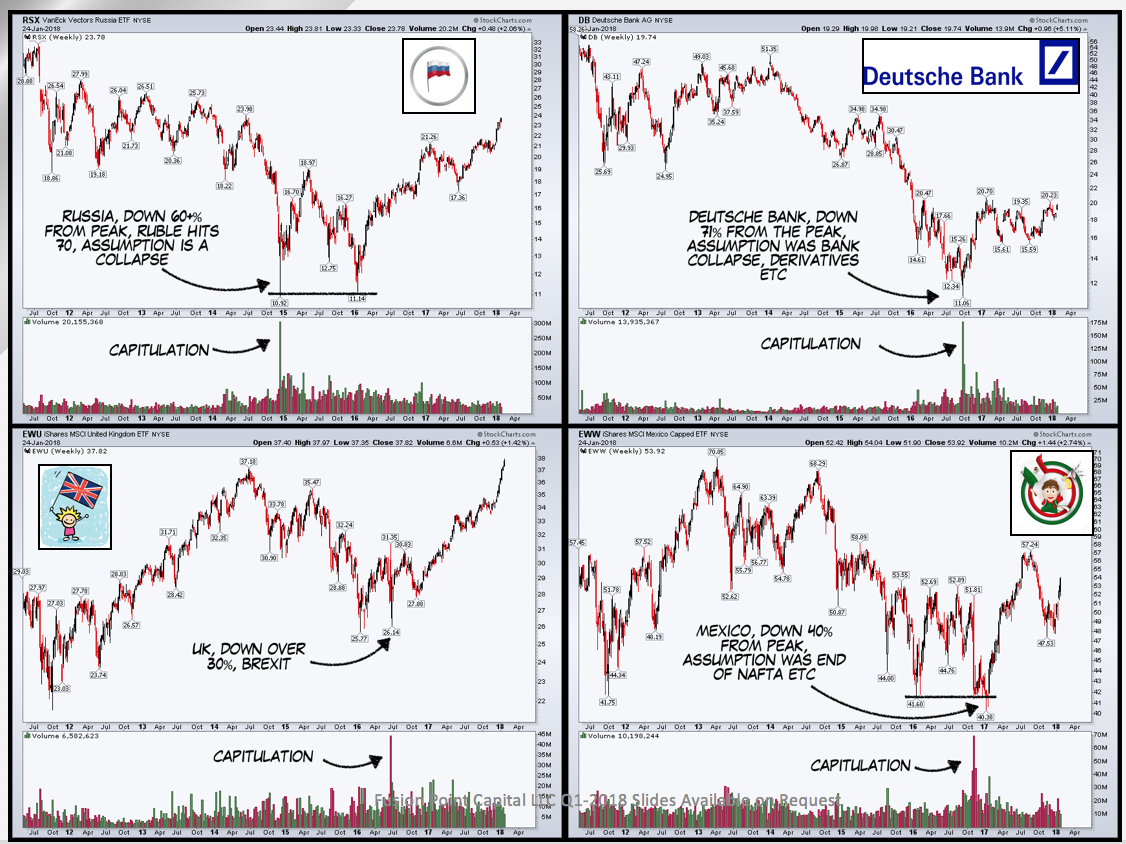
Here's a compilation of some of my largest macro trades over the last 4-5 years, centering around groupthink. All of these are 'collapses' that simply never happened (most were priced in). There is more to the following in terms of technicals, but the point is simple: everyone gets on the same side of the boat only to see nothing happen (and often the opposite does). The only surprising thing to me is how often this occurs.
- Upper Left: Russia (RSX) 'collapse' when ruble hit 70.
- Upper Right: Deutsche Bank (DB) 'collapse' in 2016 because of 'derivatives'.
- Lower Left: UK (EWU) 'collapse' because of Brexit.
- Lower Right: Mexico (EWW) 'collapse' because of the election and NAFTA.
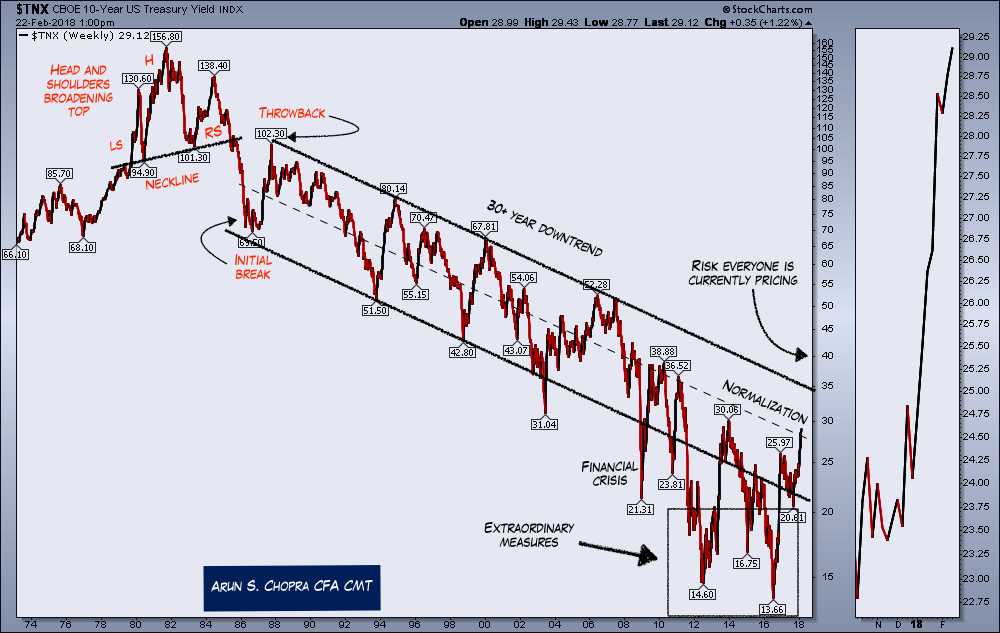
Yields: A Sober Look
What is unique about this moment with respect to Treasury yields is the 'chart malpractice' on top, which is helping to further drive an already crowded trade and a badly wanted narrative (crash!).
I am not sure I have ever seen this sort of combo. Essentially we have 'bad' data (chart malpractice) coupled with the natural financial market mechanisms (proclivity to groupthink) creating a very interesting environment.
I posted this recently to make the point.....
Ok ok ok, so what do the long-term bond channels really look like then?
Glad you asked. Below I have posted the 10-year yield on the left and the 30-year on the right. These are also long-term charts, going back over 40 years. Do these look drastically different from the above? They should.
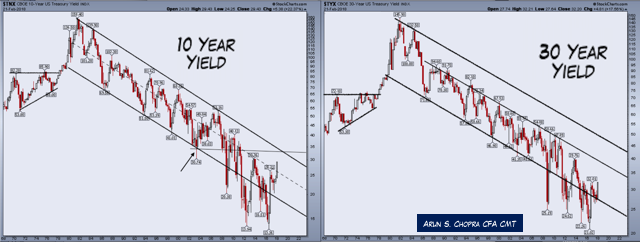 Note the 30-year (right side) is nowhere close to breaking out of anything. If anything the two following charts should alert the extremely detailed-oriented to see the curve flattening, but even then this issue has been mischaracterized (for another day). The bottom line is that these channels are fully intact.
My View
We've known for almost a year now that the Fed has intended to 'normalize'. Most know I am no big fan of the Fed, but it's extremely important to know when to push against them vs. going with the flow. Part of the reason I was able to see the equity melt-up last year was that I simply accepted the reality of the environment instead of screaming about valuations, my opinions and so forth (full article: The Melt Up).
Similarly with the bond market, all I see currently is a move back into trend and towards 'normalization' that has been part of the Fed's plan for some time. I don't see a 35-year trendline breaking out, regardless of the volatility spike last week, which was more of a buildup of years of mispositioning than an actual test of higher rates on the economy.
Furthermore, so many deflationists for the last 8 years have warned how low rates were a sign of the 'new normal' and how we would never be able to have positive inflation. Now that we're seeing some normalizing, many are jumping all the way to the other side of the fence, claiming rates are too high. Hard to have it both ways, but more importantly there is one scenario that remains unconsidered by this crowd - simple 'normalization'. To my mind that lessens credibility.
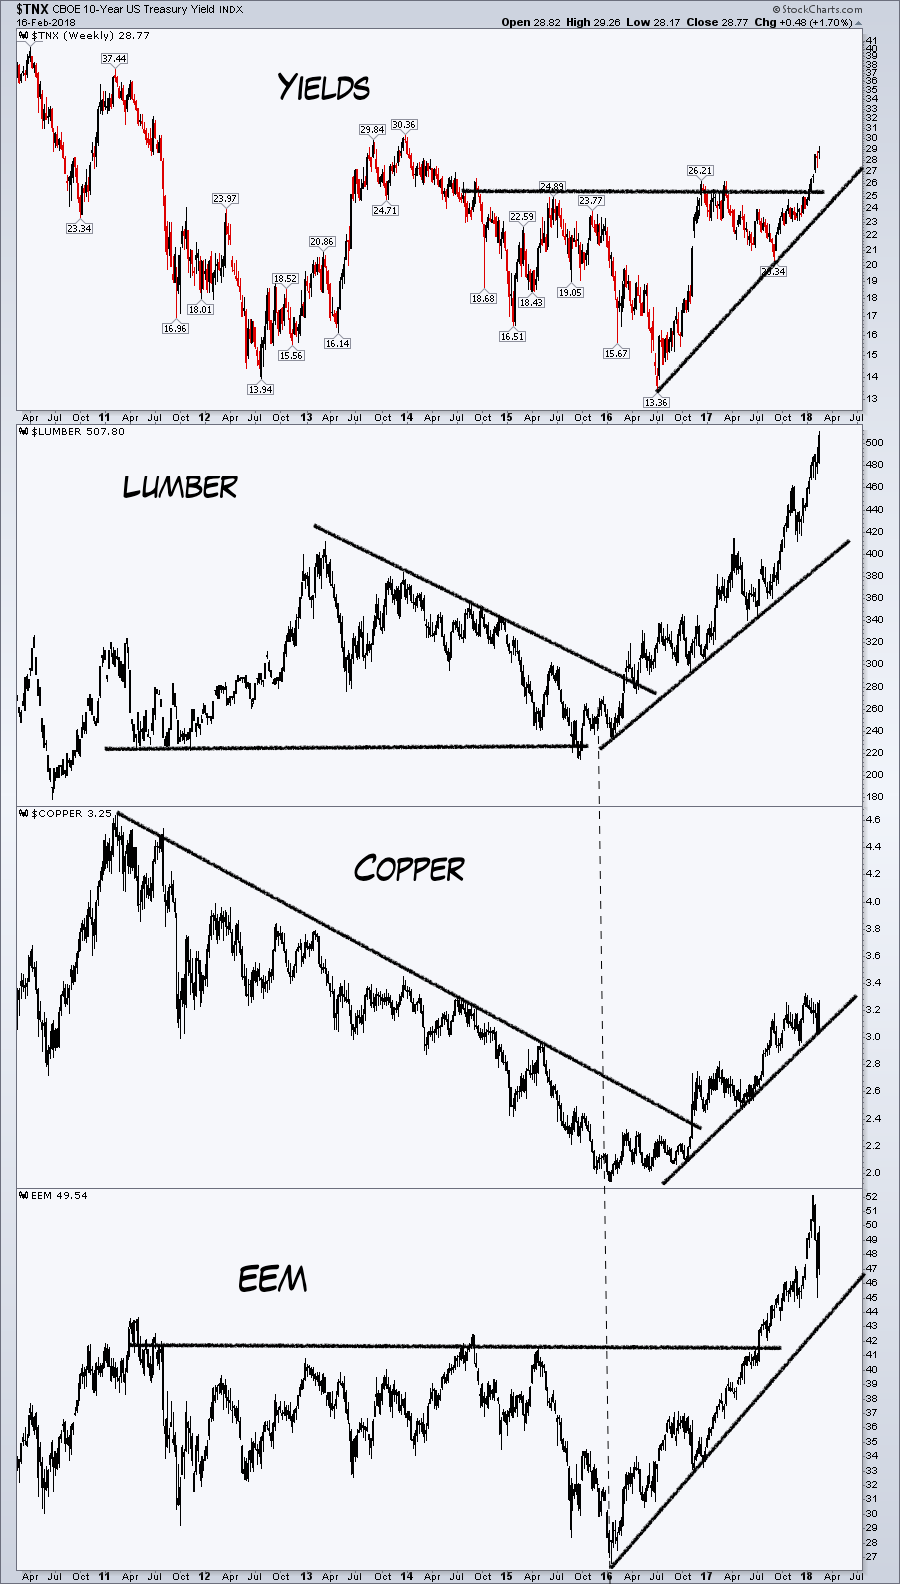
A good depiction of this 'normalization' process can further be seen in the following chart. If you look closely you can see lumber, copper, and emerging markets all bottomed before yields. These are three highly 'growthy' sort of cyclicals. As a thought experiment, imagine what people would be saying if all 4 were breaking support and/or in steep downtrends. How is this not a market functioning the way one would expect?
Confirming Indicators
Having said the above, those who hadn't been on alert and positioned for shifting regimes certainly have already felt some pain. Although I'd argue that is a high level of complacency, as we knew rotations were under way, that is behind us at this point.
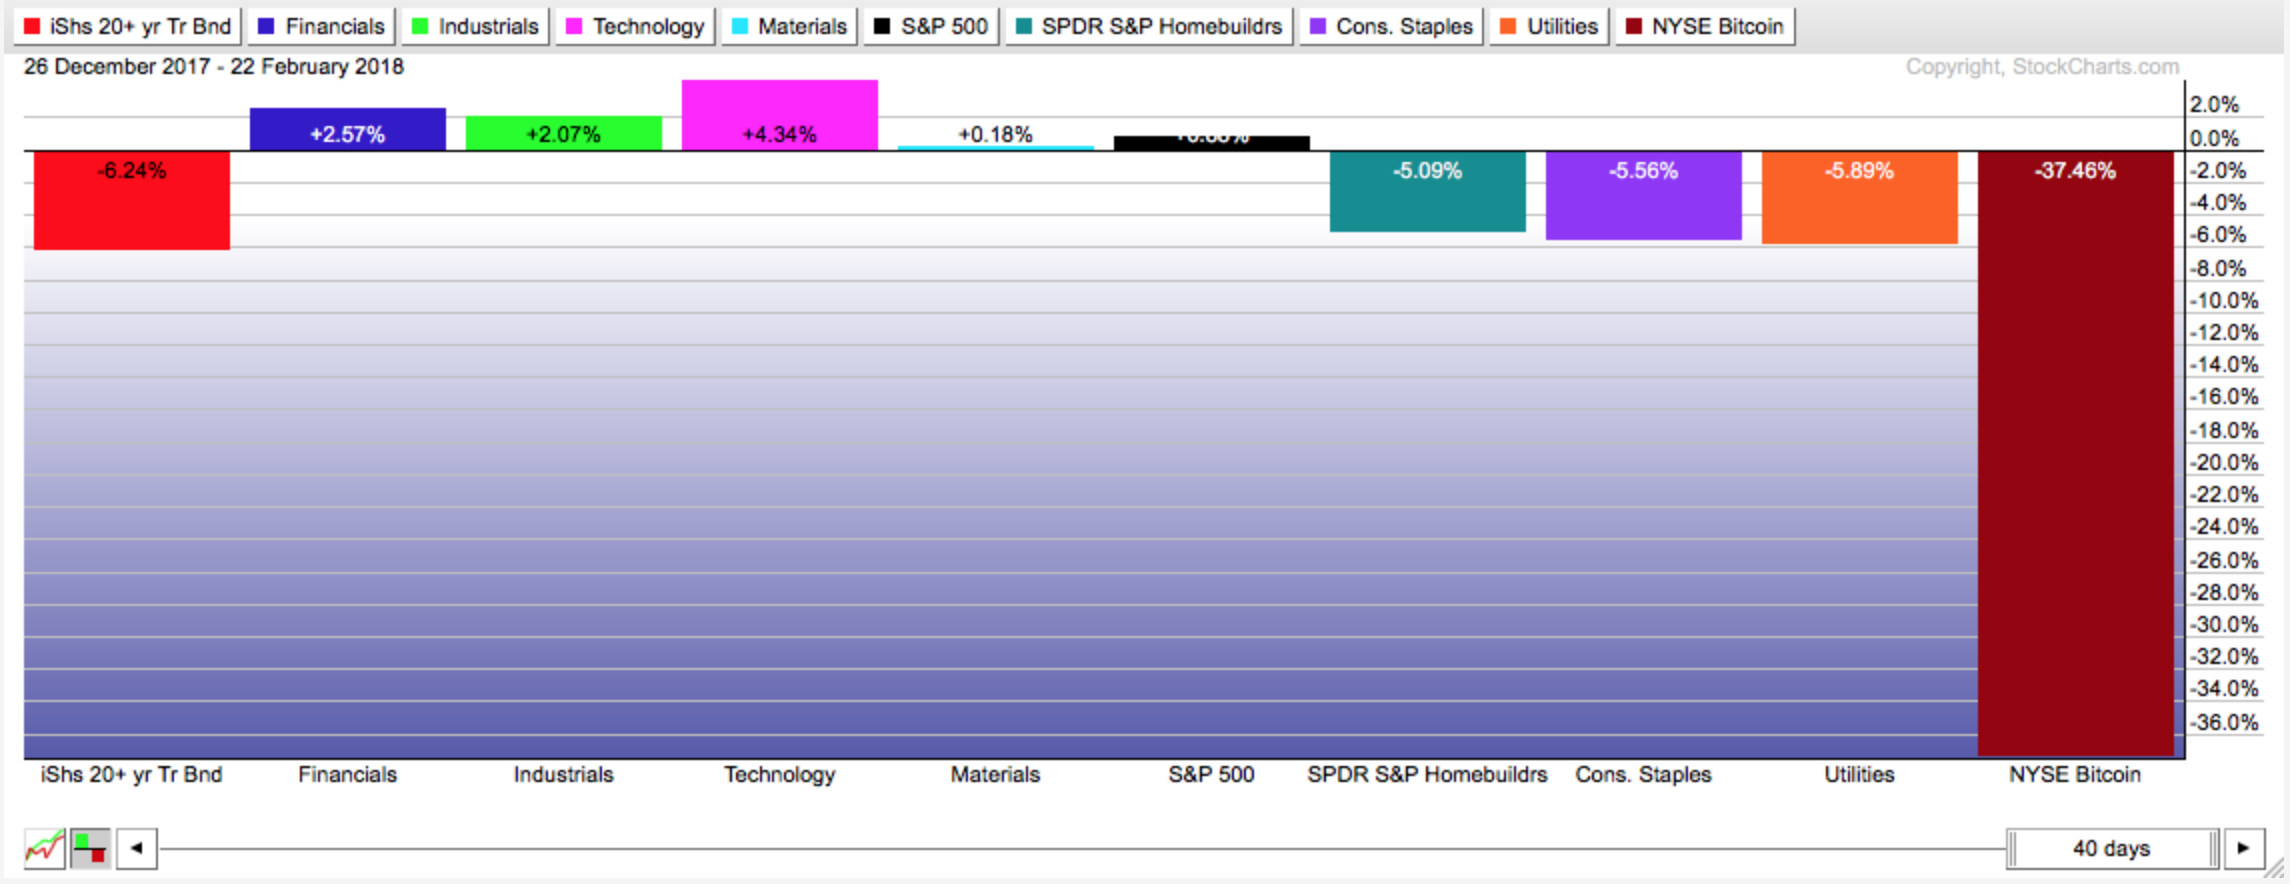
Let's first look at returns across some sectors since the top in iShares 20+ Year Treasury Bond ETF (NASDAQ:TLT) last December. The importance below is this: note the 5-6% decline in TLT is matched across the far right of the chart (rate sensitive spaces). We see the middle of the chart showing good resilience (rotation, reflation etc). Last, look at Bitcoin, which has really taken the brunt off higher rates.
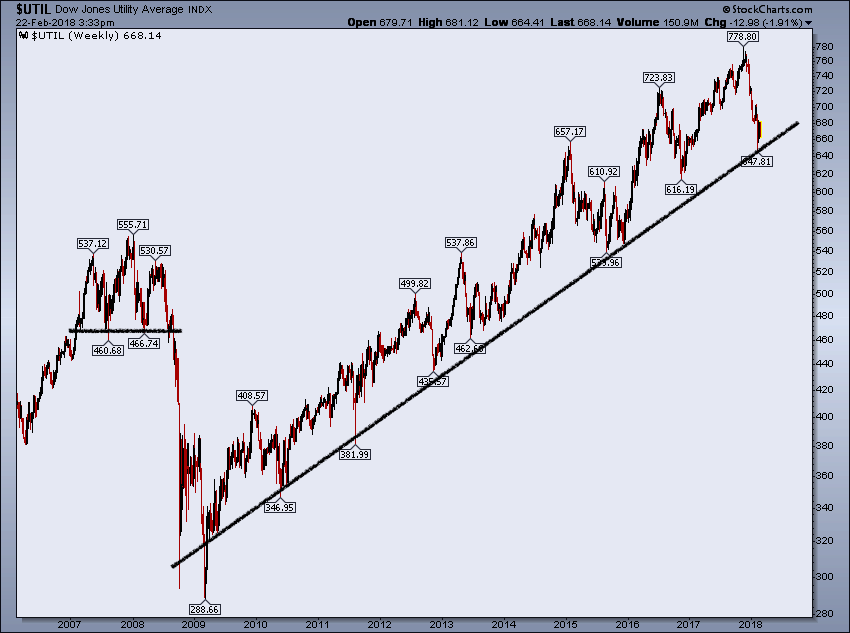
Across the rate-sensitive complex, on a long-term basis it's clear to me the bond scare is just that. Below, utilities are still holding their multi-year uptrend. Although not a place I'd be overweight, this is a good area to keep an eye on.
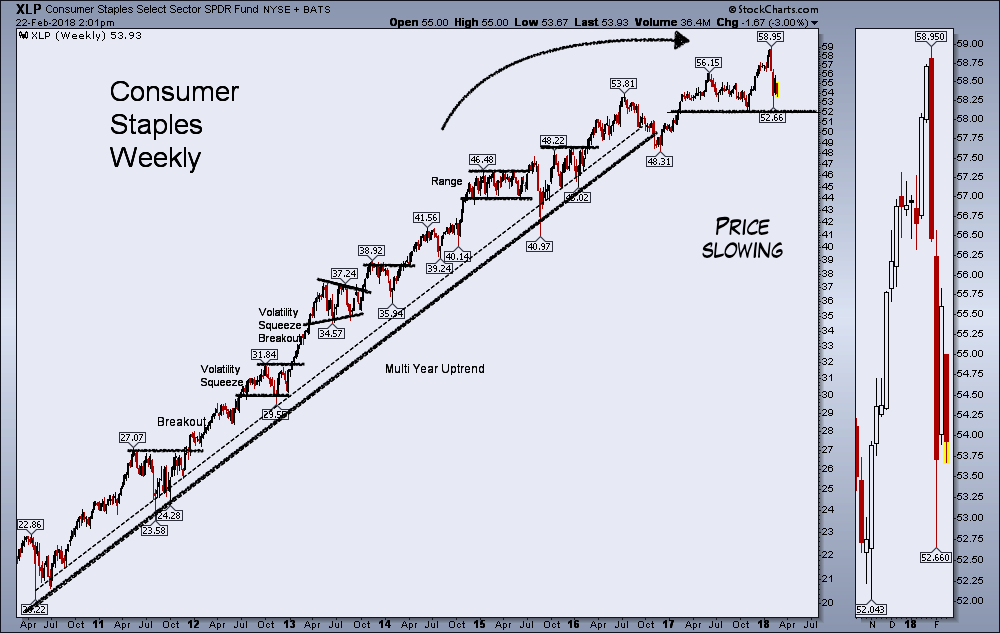
Consumer staples is another area where we'd expect to and have seen weakness since the yield rally (-5% or so). The bottom line is, although price has slowed (in one of most reliable spaces in the past), there is still bigger-picture support that hasn't broken down.
Outlook
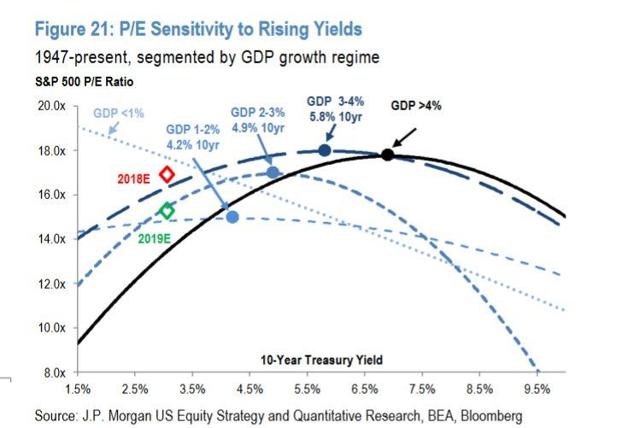
Ultimately no one knows where yields start to impact the economy negatively. A couple of charts I wanted to add here are things I am looking at. The first includes a P/E sensitivity analysis to rising yields. The bottom line is, we need to be thinking in terms of the combination of growth, yields, and valuations to find the sweet spot. Starting at a relatively expensive market means this will be challenging without question for long only portfolios, but the key point is there are a few dimensions in play (not just rate levels and valuations).
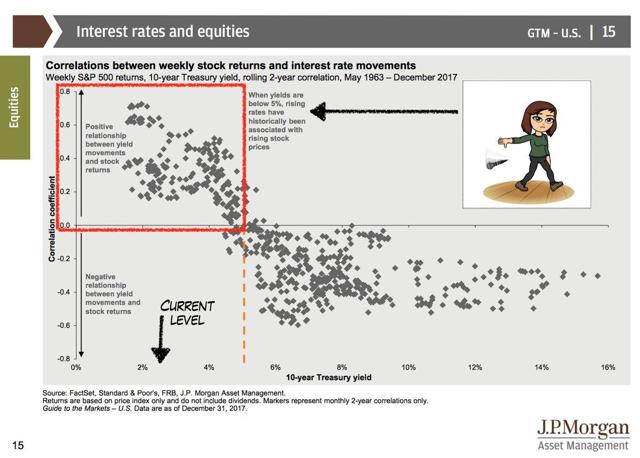
And finally the last chart, a look at yields vs. stocks and where the impact is historically felt. The chart below from JPMorgan Chase (NYSE:JPM) shows that this typically has been 5%. Although that feels far too high given 8 years of ZIRP, it's a decent thought exercise. There are numerous reasons today's economy (and government debt) cannot handle that level. We should also be aware that we are at best at 3% on the long end today, with again, the most bears in the space ever.
Conclusion:
We are late in the Information Age, so to speak. With so many platforms for charts, content, and the like, and with everyone chasing eyeballs (even major publications), whom one listens to has never been more important. Having a proper filter can be tough, particularly in finance, and especially in technical analysis (subjectivity, etc.). As a Chartered Market Technician it pains me to see the above charts getting so much attention (even among those with experience). Outside of the obvious opportunity it creates, the bigger picture is that we should at least provide some balance to the conversation, especially when there is clear evidence and it is warranted. To my mind, the current narrative on yields deserves that much.
Thanks for reading.
Disclosure: I/we have no positions in any stocks mentioned, but may initiate a long position in TLT over the next 72 hours. I wrote this article myself, and it expresses my own opinions. I am not receiving compensation for it. I have no business relationship with any company whose stock is mentioned in this article.