The Bitcoin Bonanza

December 2017
- Bitcoin has had a historic run.
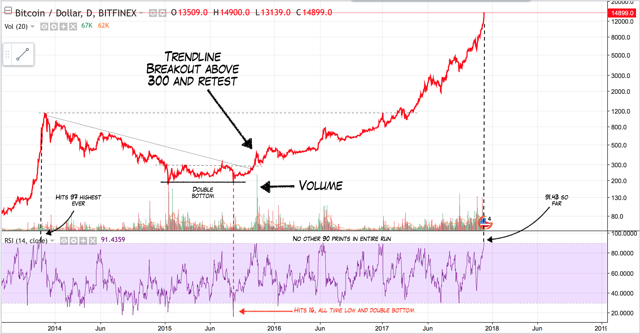
- The time to buy was the breakout of the downtrend in 2015 and close above 300.
- Fear and greed are the two most powerful market forces.
Investing vs. speculating in a boom/bust system.
In all my years in finance, I've never seen anything like this, particularly on the upside. The data says no one has.
Before I get started, let me say I am not a crypto hater. As a former gold bug during 2005-2011, the goal of decentralization is well understood. I know what I need to know about these vehicles and wrote about the boom to technicians this market has provided in my past article Cryptocurrency Charts!
With that said, on to the bonanza...
Chart Watching
Technicals get mixed reviews. On Seeking Alpha, it seems to be a lukewarm sorta deal. Which is great, in the end it's highly subjective. I'd argue so is fundamental valuation, but that is for another day.
Technicals can, however, tell us a lot about emotions. This is where I've had the most success with chart analysis, both on the upside and down. Some of my largest trades have come from capitalizing on both the fear and greed of others.
What I said, when I said it:
It was 2 short years ago, but here are my 'bitcoin' emails. Figured it was time to dust these off. Hopefully, they help show how being open to pattern analysis, new technologies, and price action can help keep one's own views and emotions out of the trade. They absolutely speak to knowing WHEN to buy what others won't, the combination of which is required when finding AND profiting from value.
Extremely important was that the sentiment at the time was fully in the toilet. The 'fear' part of the bottoming process had passed, it was on to outright dejection as no one cared. Many don't remember, but in 2015, Bitcoin was under serious ridicule.
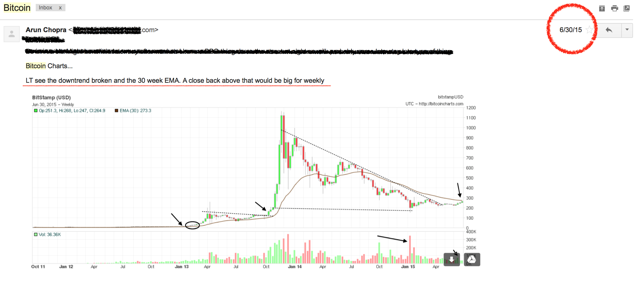
6/30/2015
Bitcoin charts start to setup on the weekly time frames.
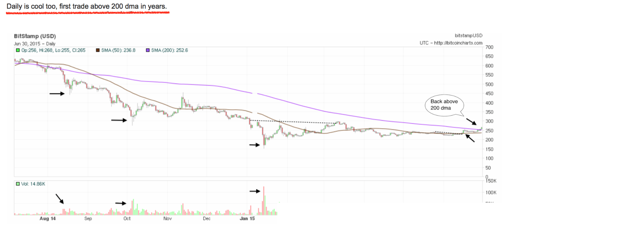
Continued from the above message, Bitcoin price was also showing some signs of demand, as price was quietly closing above the 200-day moving average. This multi-time frame analysis is an important part of studying price.
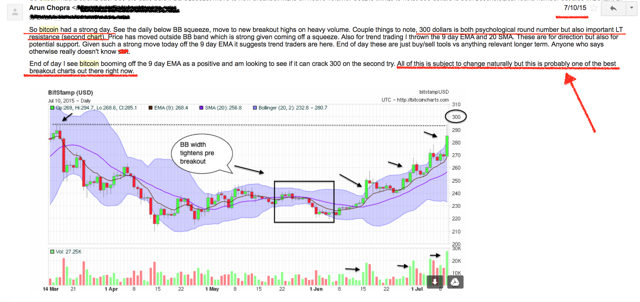
7/10/2015
A few months later price continued to stay constructive, so much so that Bitcoin became my favorite 'base' breakout in play. After the downtrend had broken, this was the next natural step.
Note the key importance on 300 as a 'round figure' and the longer term base resistance. Round figures can act as psychological barriers and can clue us into bigger picture market dynamics, especially if there is past resistance there too.
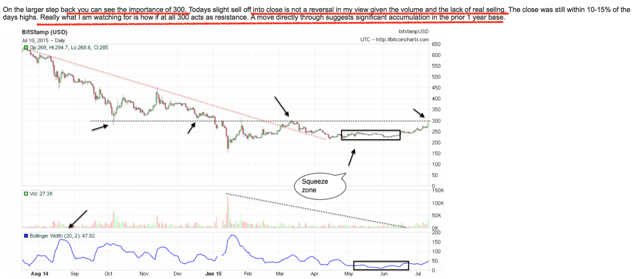
Continued from the above, see the base build as volumes tightened and price tried to turn the corner above 300.
The rest is well, history.
Bitcoin Today
Fast forward to today. Just over 2 years later. The RSI on Bitcoin as I am typing this is hitting 91+. That is the second highest on record and the second only 90+ reading. Note the low around the same time as the emails above was 16. Is the RSI reliable? Maybe, maybe not. This is simply a reflection of the momentum that we all know is on absolute fire.
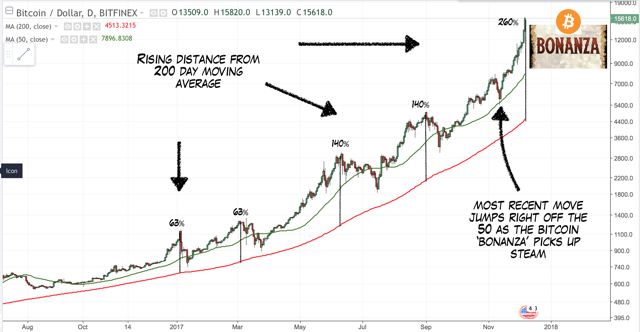
Some more current day analysis. Take a look at the chart below which measures Bitcoin's price distance from the 200-day moving average. Note the prior intermediate peaks at the start of the year when price was about 60+% above (red line). That number then moved to 140% twice in the summer. Now we are sitting at 260%. Again a signal? Probably. But more so a quantitative reflection of the parabola we can all see taking place.
One thing to note, the above doesn't mean the market will crash. I actually think the likeliest way this market 'gives back' is by creating a mind numbing and extremely frustrating bear market. Although a parabolic blowoff 'should' collapse back, I could see this thing end up doing the meat grinder. Time will tell, but I am pretty sure the payback for this level of momentum and performance chasing won't be kind.
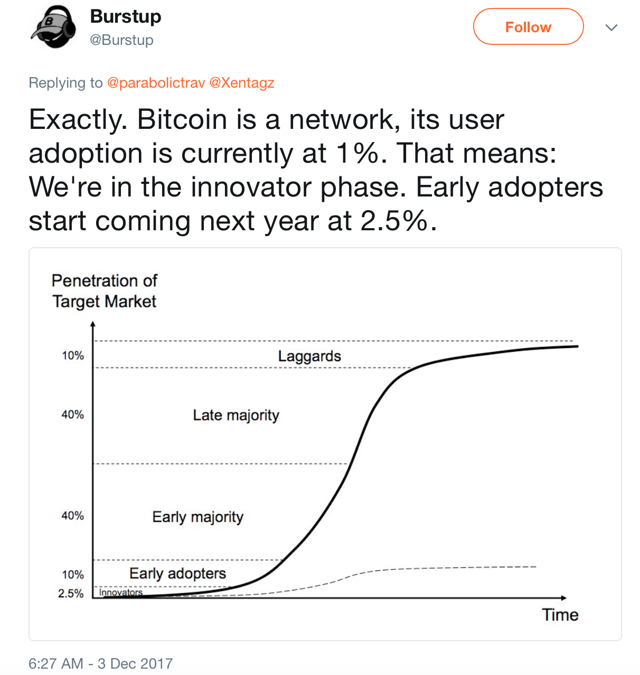
And for the currency/technology 'adopters', I get the argument. I suppose here's how you get to 100K. Or more. In a straightforward fashion. Forever. Essentially. Fair enough?
Maybe. I remember the gold 10K arguments as well. If X percent of global capital moved to gold, given the gold supply, price would triple. I think silver was supposed to go to 150. That money never rotated. I got out when silver was above 40 (including 75% of my physical). When a friend's parents and their friends started buying 'SLV', I knew it was time to bail (not to outdo my detailed analysis of the futures curve at the time).
Momentum
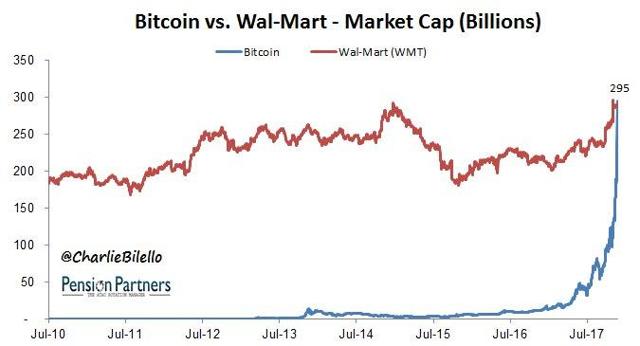
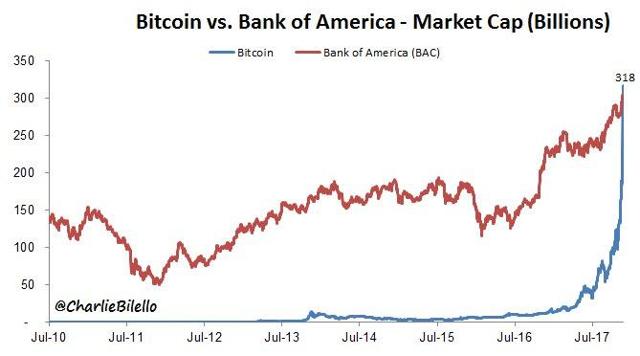
What we do know is we've seen this type of momentum before. Using a 'market cap' measure for Bitcoin may not the best practice (particularly for those focused on adoption rates), but it's one way of viewing where we are. Just this week the market cap surged past Wal-Mart's (NYSE:WMT).
And Bank of America's (NYSE:BAC)....
And Wells (NYSE:WFC)...
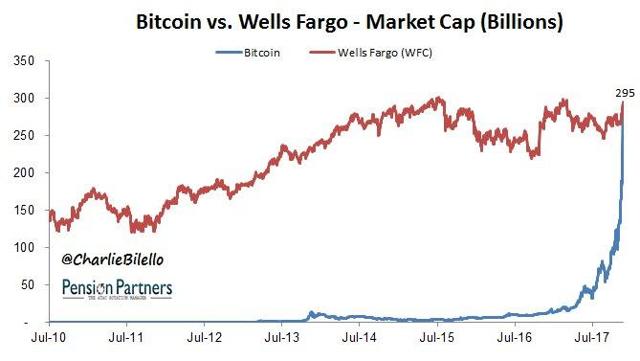
And is now 'worth' more than something like 95% of the S&P 500. Bonanza.
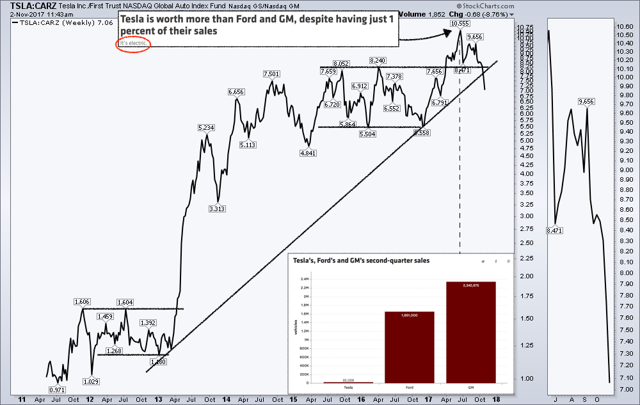
But we've seen this story before right? Who can forget when Tesla's (NASDAQ:TSLA) market cap 'surged' past Ford (NYSE:F) and GM's (NYSE:GM) despite having less than 1% of their sales?
Of course, this was also when the stock peaked in relative terms (the chart below compares Tesla to other automakers) and a few months later, in absolute terms.
Emotions
But back to emotions. They are funny things. In markets, emotions are the underlying currents. The idea the markets are efficient flies in the face of common sense and experience. Moving the goal posts on what defines efficiency (strong, semi strong, weak, wait but your manager is efficient, etc.) is frankly, silly. If anything, the 'manager' is the least efficient (see the sudden institutional interest in Bitcoin).
This was the breakout year for 'behavioral' finance (Thaler), one of my most coveted components of finance. I think even Greenspan this week mentioned that 'people value stuff for all types of reasons' when asked about Bitcoin. Seems like he's having a bunch of revelations this year. I guess in some respects he's always been a behavioralist (irrational exuberance). I don't know. Let's not talk about Greenspan.
But let's be honest, one of the biggest emotional levers happening in bitcoin's current bonanza is the drive to decentralization. And again, I have NO issue with it. But read the market's psychology as price has gone higher, it's taking on a cultish level. As if buying Bitcoin at any level will not only work immediately, but make big big money (5X, 10X), because decentralization is good, just, and the inevitable future. Decentralization was one of the reasons I liked it at 300 in 2015. It was clear gold would be capped. So what?
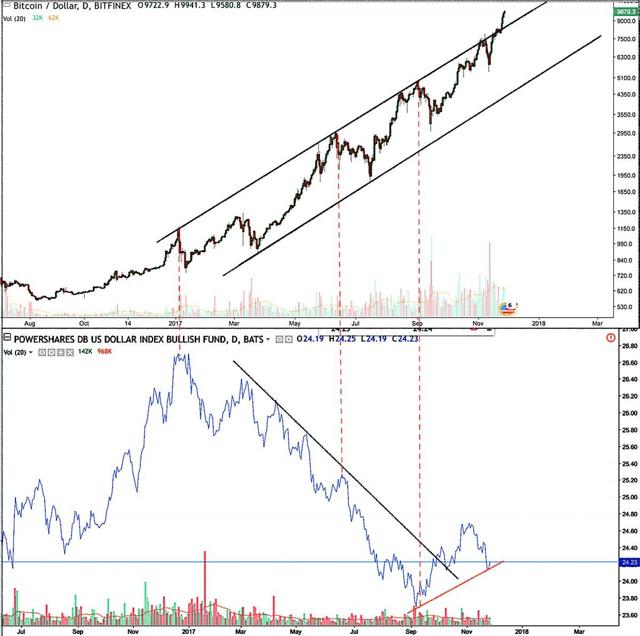
For all the fiat killers out there, now would probably be a good time to recognize the dollar having not made a lower low on this last ramp in BTC.
Semis
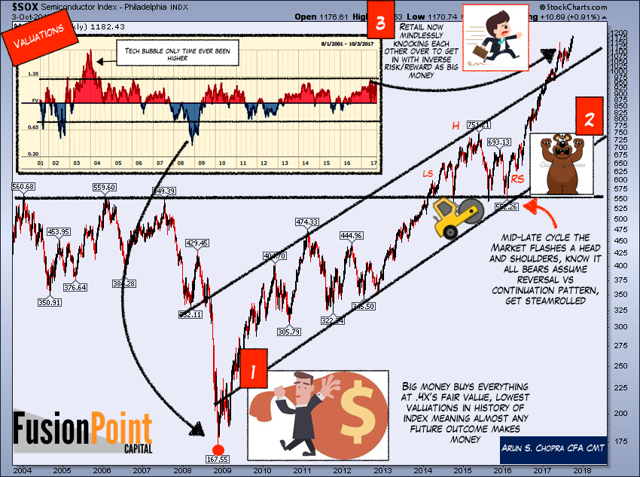
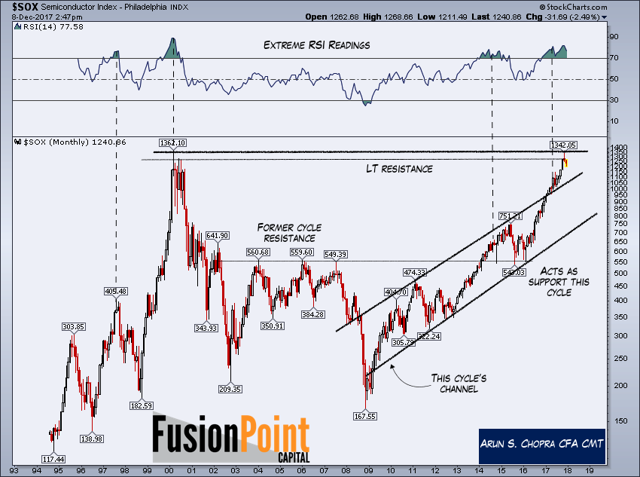
Semis play a role in the 'Bitcoin bonanza' as well as well. The chart below speaks to what I see. This is simply how markets work. Fear leads to panic, panic leads to recovery, recovery leads to skepticism, skepticism to optimism, optimism to confidence, confidence to arrogance, arrogance to greed. All of which eventually leads to... bonanza.
Taking a larger step back, with price completely outside the channel, Semis nailed their 2000 highs. Although it's just a 'level', the expected initial selling doesn't tell us much. For now, it's a technical knee jerk. Time will tell here as well.
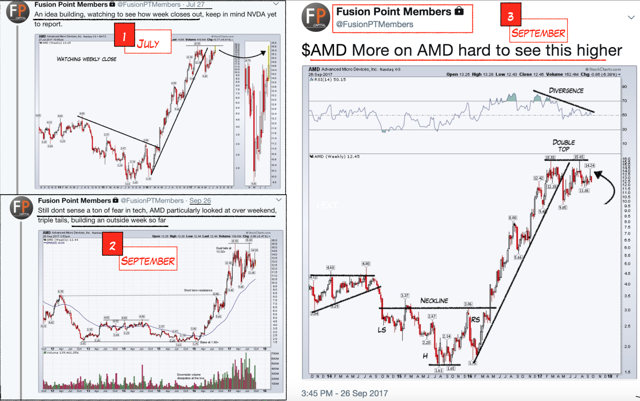
Advanced Micro Devices (NASDAQ:AMD) has been a main short since the summer for me. There was a lot of fundamental research written on this name, but ultimately, it bumped its head against that 15 level for months before finally rolling over. Last I checked, they are still losing money. Technicals when coupled with the right sentiment do often matter, and now bulls here face their first real challenge (easy money for long time).
Booms and Busts: Investing vs. Speculating
In 2010, I was working with a friend out in California. He had setup a new investment fund to buy Arizona properties post crisis. The government was beginning to worry about people flipping foreclosures, so they effectively created a preferred buyers list. Some may remember. He had access. He also had the opportunity to pick through the supply pre-auction, another perk from being in the field for decades with a once in a lifetime collapse.
Here were the numbers. Homes would be bought for approximately 40k. At auction, they were selling for 50+K. The replacement costs were approximately 100K. At the peak, these homes traded at upwards of 300-400K.
The rent at the time was $900 per month. They were easily rented out. We ran a traditional 2% per year increase in Arizona home values from the 1995 price (about when the market started to deviate) to establish a baseline, the level was give or take 150K. This in theory is what pricing would have been had there been no bubble. Who would do this trade?
I'm guessing most reading in 2017 would say of course. How many can I do. That sort of thing. The rent alone was yielding double digits. But guess what happened? No one bit. Here were the responses...
- Property? Immediate dial tone.
- Sorry, I can't be illiquid
- It will stay cheap for a long time, never coming back, especially Arizona.
- Insert almost anything else you like here (shouting, laughing, etc.)...
The most common answer was liquidity (stay with me here). That beyond all else. Liquidity, liquidity, liquidity. This was the latest and greatest catch phrase after the crash. Gotta be 'liquid'. There was a natural deep distrust creating a post-bust mentality that nothing was safe.
And think, really, how illiquid were we? I guess some. But the properties were in the 3 top counties in Arizona, they were paying cash distributions, you get the point. Plus, there's lots of research showing better long-term returns come from less liquid assets, assuming at least decent initial pricing and the ability to hold. But a boom/bust system erodes investor balance.
So what did we do? Well, so we changed the terms, and said ok fine, how about same deal, except IF in the OFF OFF chance any of these properties were to double, we will immediately sell and pay back your initial investment. Cash out. Liquidity! Sound better?
Still a not really, but maybe. Face-palm. It took over 4 months to fill that fund and it ended up being $10M smaller than intended. Ultimately, it took the support of 3 larger investors who took down 65% of it.
Today, those properties trade at over $150K, they rent at near $1,200 a month, and here's the irony. The fund has returned almost all the capital due to forced selling in the prospectus! They all doubled years ago.
Although the returns were still good, I calculated the lost capital gains and income to date, and then ran a theoretical 'if you held' for the next 20 years. It was a lot.
So why am I telling you this?
Well, fast forward to today, can anyone remember seeing any greater speculation, particularly in Bitcoin, especially when it comes to custodian risk, liquidity risk and so forth? Call it structural risks. It's night and day.
Trading margin on unregulated exchanges, with hackable digital assets, getting stopped out, and closed out, at levels that Bitcoin didn't even print for the day (I have seen this happen). 50+K amounts. It is incredible. That's more than each property costed in 2010. Gone. Vapor. What?
It's difficult to comprehend unless one recognizes the history of the boom-bust system we have. The same psychology behind shunning every opportunity post crisis, and even forcing us to create stipulations that hurt long-term performance is now occurring in the exact opposite phenomenon.
And although I personally 'understand' cold wallets, and how to prudently own cryptocurrencies, it is almost unbelievable to see such a large behavioral shift, so fast, all basically in 2017. Almost.
To my mind, none of this would be as speculative if it weren't for prior booms and busts. The multi-year low rate, low vol, yield chase environment dam ultimately broke in 2017. You can bet new buyers here have no idea about any of these nuances. Even the exchanges are overwhelmed.
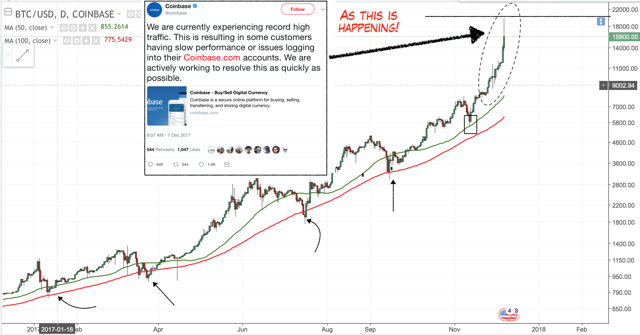
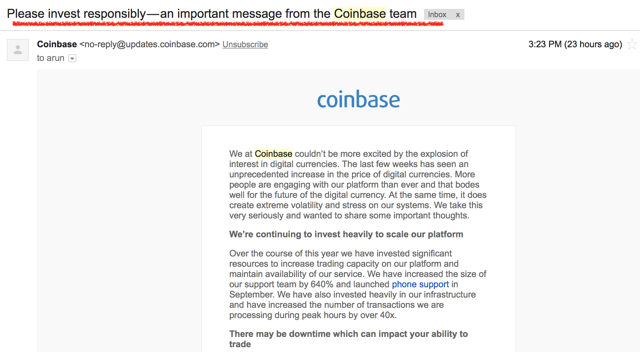
The fever is so high Coinbase had to send out a warning about investing. Has anyone ever seen anything like this? The custodian or exchange warning the investor from, in some respects, itself?
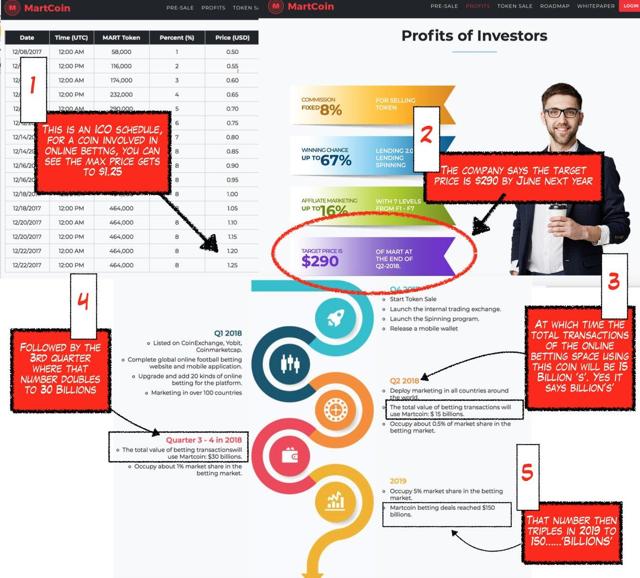
Take a look at this ICO. Is this some kind of a joke? Or something much worse. If you read the white paper, you will see they got their TAM numbers for global gambling from an online article, which itself had simply cited a random UN speech. Obviously, this is one ICO from thousands, and are in their own category, but the following is reflective and absurd....
Given the history of markets, and the large scale differences between true bottom fishing investing (almost impossible to lose, bitcoin at $300, homes in 2010) vs. insane speculation (impossible to win, I'd argue parts of the current crypto space and semis, etc.), it's clear to me where we are in this one.
Fear vs. Greed
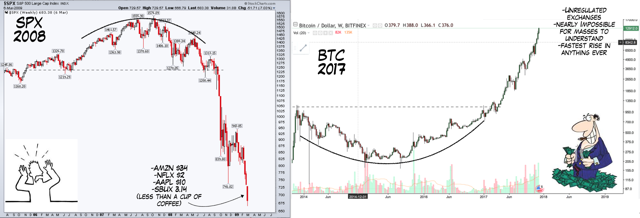
I will leave it with this final chart. It has been said fear is a greater emotion than greed, but Bitcoin has proved to me greed has some serious legs as well. More than I realized. I doubt I personally will see such extreme examples of either as the below ever again, but in markets, as with emotions, you never really know.
Thanks for reading...

