The March 23rd Low
Arun S. Chopra CFA CMT
Hi Everyone,
After highlighting my move to safety in February (The Move to Safety), I thought it would be a good time to review the signals and tools I used to see the bottom in March. The key point today is not only anticipating market environments like we've seen, but having tools to profit from them.
Last week I came across this tweet by Meb Faber and it reminded me of the insanity we've seen not only during the recent rally but really the past 12+ months.
Over the past 12 months:
— Meb Faber (@MebFaber) June 5, 2020
Unemployment jumps from 4% to 13%
Fed interest rates fall from 2.4% to 0%
PMI dives from 52 to 43
Gold rips up 30%
Stock volatility up 40%
Stock valuations top 10% expensive vs history
(also a pandemic in there somewhere)
S&P500 up 14%
In the face of all that, we still saw an over 40% rally in stocks, which to an extent comes with the territory, but definitely more aggressive than anyone expected.
Obviously the...
The Fed Pulls The Punchbowl

Arun S. Chopra CFA CMT
November 2018
- Markets come under pressure as the Fed pulls the punchbowl.
- A look at how to monitor liquidity across equity markets.
- Why and how I shorted NVIDIA and Netflix near their peaks.
A deeper dive into credit and dollar dynamics.
After calling for major breakout last year in "The Melt Up", I switched to a much more cautious stance as the calendar turned over. There were four major factors coming into the year I was most concerned about. I often see laundry lists of concerns; I have found that somewhere between pointless, redundant, and confusing. The following four however lined up perfectly and were powerfully simple (no particular order).
- Proprietary exhaustion indicator fired in Jan., first time since 2014
- Election Year Seasonality
- Fed Policy
- Trade War
It was these four reasons that I stayed balanced in 2018, with 65% equity exposure on average all year, with much of that long/short. As the year has progressed, the above framework...
3% Treasury Yields Still Don't Matter

- In February I argued the rate move was overdone.
- At the time many assumed rates were breaking out.
- How price and sentiment help determine future price action.
In February I wrote an article titled '3% doesn't matter'. This was about two weeks after the market hit its peak with respect to the overall rising rate fear.
There were 3 primary takeaways from my initial article.
- Rising rate concerns had hit a fever pitch
- 'Bad' charts were being passed around everywhere, artificially adding fuel to the fire
- The correct interpretation of yields showed a healthy rotation and/or normalization process
Today I will review the 2016-2018 cycle in yields, including price action, sentiment, and the impact to specific sectors. I will then take another look at where we stand overall on the 10-year treasury yield today.
Price and Sentiment
I've been consistently quoting Gundlach's comments on the value of technical analysis from a few weeks ago, more...

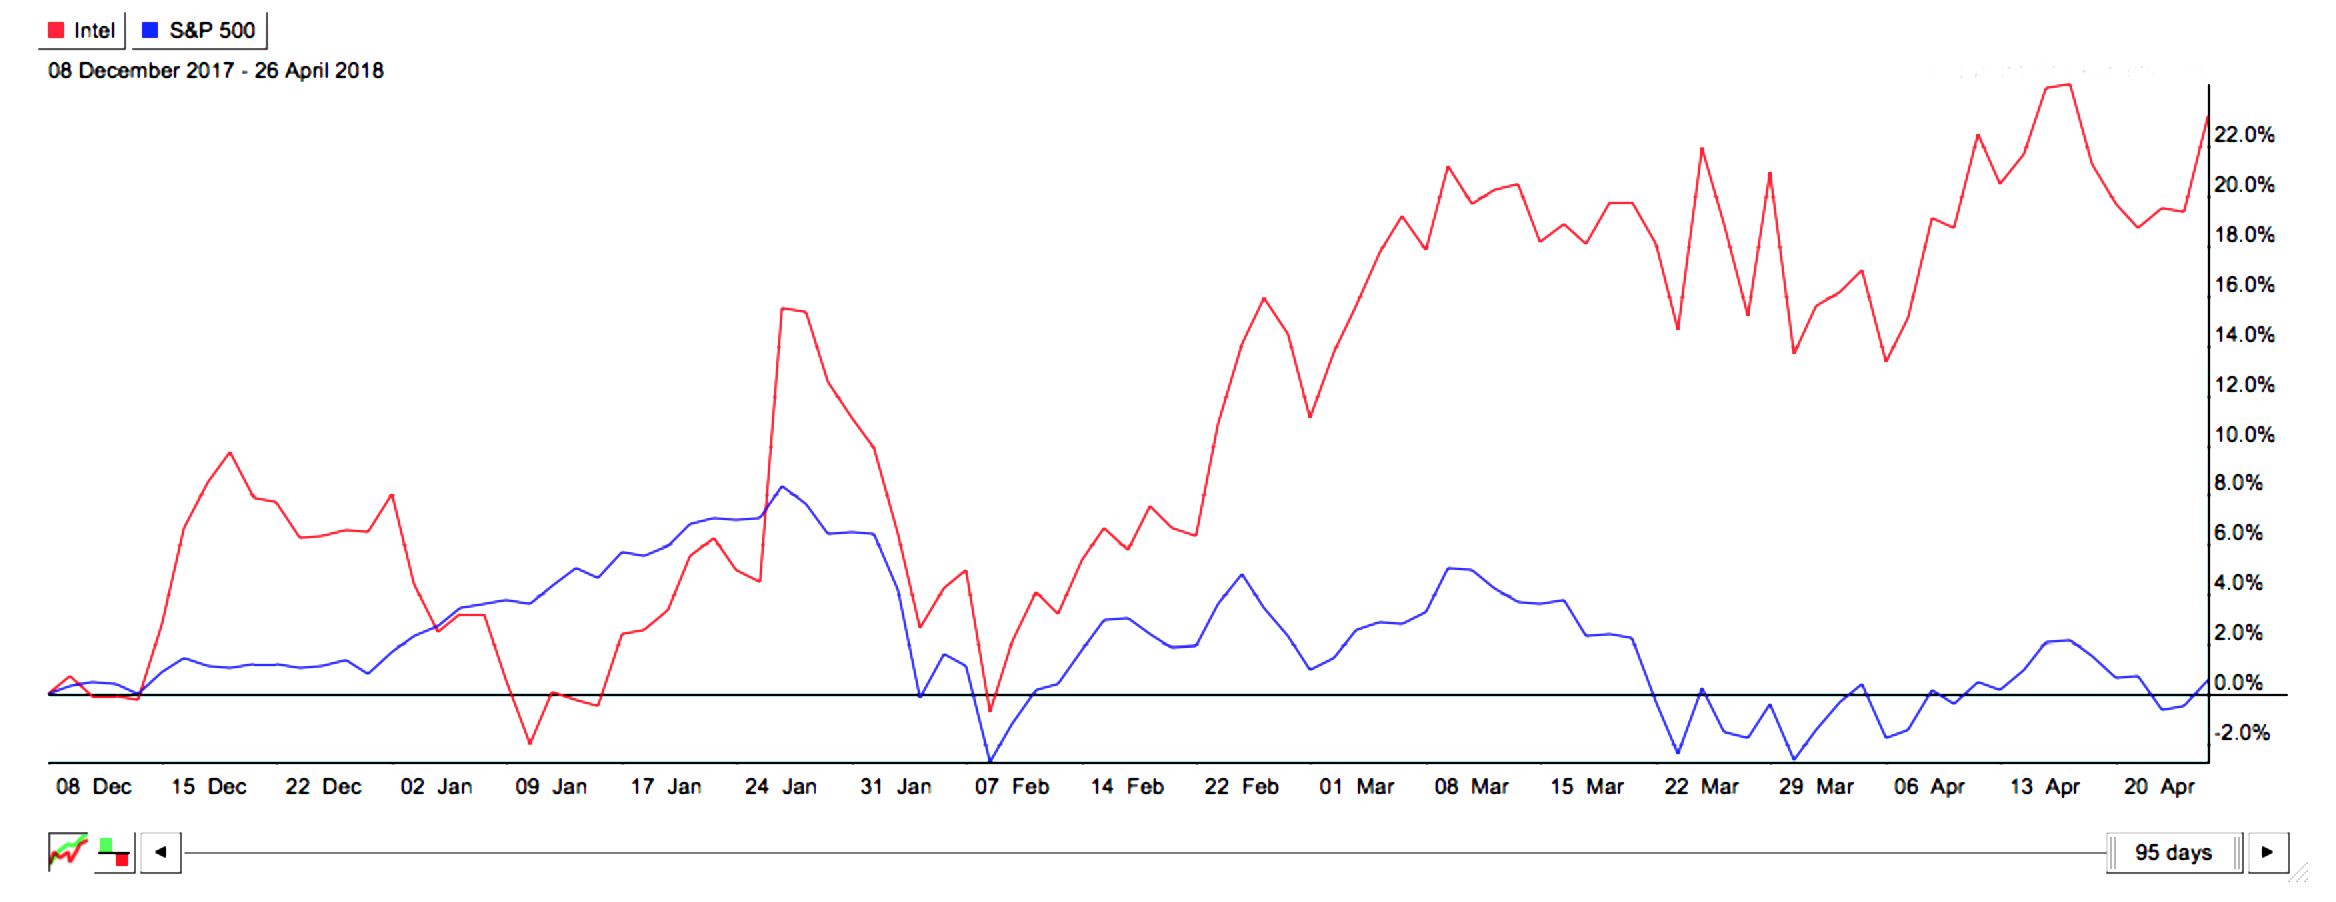
Intel: The 15-Plus Year Breakout - Part 2

April 2018
- Price has zoomed 22% since the original article.
- A look at why.
- A deeper conversation into longer term price action.
Since I wrote Intel, the 15+ Year Breakout, on December 6th, the stock has zoomed, up over 22% vs. the market which has essentially gone nowhere. In fact Intel (NASDAQ:INTC) has been the second-best performing mega cap since that time, only bested by Amazon (AMZN).
The article initially was supposed to be about my latest "fundamental factor" strategy, "earnings yield" stocks, which is one of eight factor models I run.
The Intel analysis was rooted in two more simple 20-30K foot concepts surrounding this most recent model, and I chose it because it was one of the bigger names out of my list. The hope was it would provide a good template for the strategy I was so excited about.
Basically this was the premise at the time:
- Earnings yield model (upper panel) shows a name with significant outperformance potential, in this case...
3% Doesn't Matter

- Everyone is talking about 3% on Treasury yields as a line in the sand
- The most common long-term yield chart being passed around is flawed.
- A look at the correct Treasury yield channels.
Let's first look at how we got here...
Chart Malpractice
The most common chart being published on tens looks like the following 3 (please note they are not my charts; they are simply others I have come across in a variety of mediums). I have purposefully blurred out any contributor information as that isn't my game. This is about trying to be on the right side of the market, period.
Chart 1. The 3% resistance Level
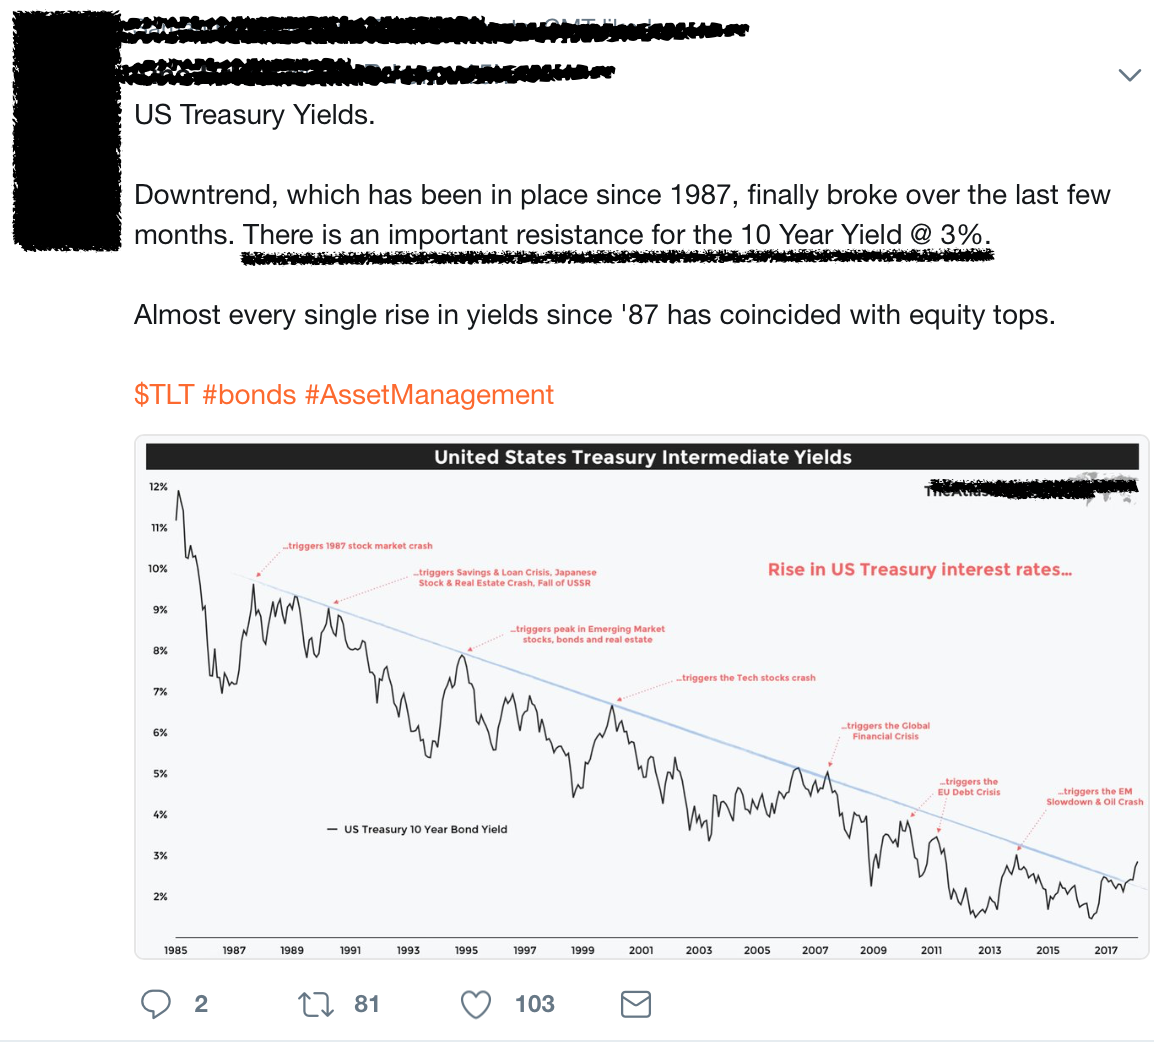
This is the market's new bear 'hope'. 'Rising rates are about to break a 35-year downtrend and 'crash everything'. For that to happen however, the chart has to match the narrative,...
The Bitcoin Bonanza

December 2017
- Bitcoin has had a historic run.
- The time to buy was the breakout of the downtrend in 2015 and close above 300.
- Fear and greed are the two most powerful market forces.
Investing vs. speculating in a boom/bust system.
In all my years in finance, I've never seen anything like this, particularly on the upside. The data says no one has.
Before I get started, let me say I am not a crypto hater. As a former gold bug during 2005-2011, the goal of decentralization is well understood. I know what I need to know about these vehicles and wrote about the boom to technicians this market has provided in my past article Cryptocurrency Charts!
With that said, on to the bonanza...
Chart Watching
Technicals get mixed reviews. On Seeking Alpha, it seems to be a lukewarm sorta deal. Which is great, in the end it's highly subjective. I'd argue so is fundamental valuation, but that is for another day.
Technicals can, however, tell us a lot about emotions. This...
Macro Correlations

September 2017
- Macro correlations are an area of particular interest. The more important ones happen in currencies, interest rates, and commodities.
- A look at how long-term technical patterns can key us to macro shifts.
- An in-depth look at the yen's influence in this and past cycles.
- A look at a current scenario.
Macro correlations have been a particular interest of mine for a long time. This includes common concepts of intermarket analysis to some of the more unique relationships that can come and do often go.
Although many claim that today's managed atmosphere has rendered a lot of these relationships useless, I beg to differ. Markets move in trends, and when large trends change, asset class relationships will change as well, creating durable opportunities. Some are easily explained by economics, others simply are what they are, market phenomenona.
Some are likely happenstance and spurious at best, but by using longer-term technical analysis, some...
I Am Shocked, SHOCKED, To Find Gambling Is Going On Here...

- SNAP and TWLO surprise fad stock chasers again.
- This is nothing new something we've seen all cycle long.
- A look at value vs valuation, lose-lose stocks, and mass media psychology.
This past few weeks we've seen some impressive 'misses' and subsequent stock declines. I often get asked about these 'fad' stocks, so I thought I'd put some of my past thoughts down.
Snap (NYSE:SNAP) and Twilio (NYSE:TWLO) have quickly put the game of ridicule, bubbles, and the associated denial back in full focus. Every time these events happen the market seems to shift between an 'told you so it's a bubble' narrative vs. 'this is part of the long term process of how growth stocks work' rationalization. But are either right? I'd argue not necessarily (certainly not the latter), but rather a process we see of 'valuation, investing, and overall gambling' that just confirms the nature of fad stock chasers. These common mistakes likely happen more in bullish/bubble...
The VIX Hits 9, So What?
- The VIX traded below 10 this week.
- Many have used this as evidence of an impending top.
- Historical data shows two past examples, with entirely different outcomes.
With the Vix hitting 9 there's been a lot of charts showing this reduced level of activity, most centering around the idea of this being a massively bearish event. While there is no debate that low volatility readings indicate a reduced level of fear and complacent behavior, this needs to be put in context. I have already written a few articles here focusing on what I will be watching in this overall bull market to help guide any longer term topping process. Today's piece is simply to put this weeks '9' reading in context. Breaking a round figure like 10 sounds great, but lets look back at the last two instances. You can see below it's entirely inconclusive.
Chart 1: SPX with VIX 1986-2017
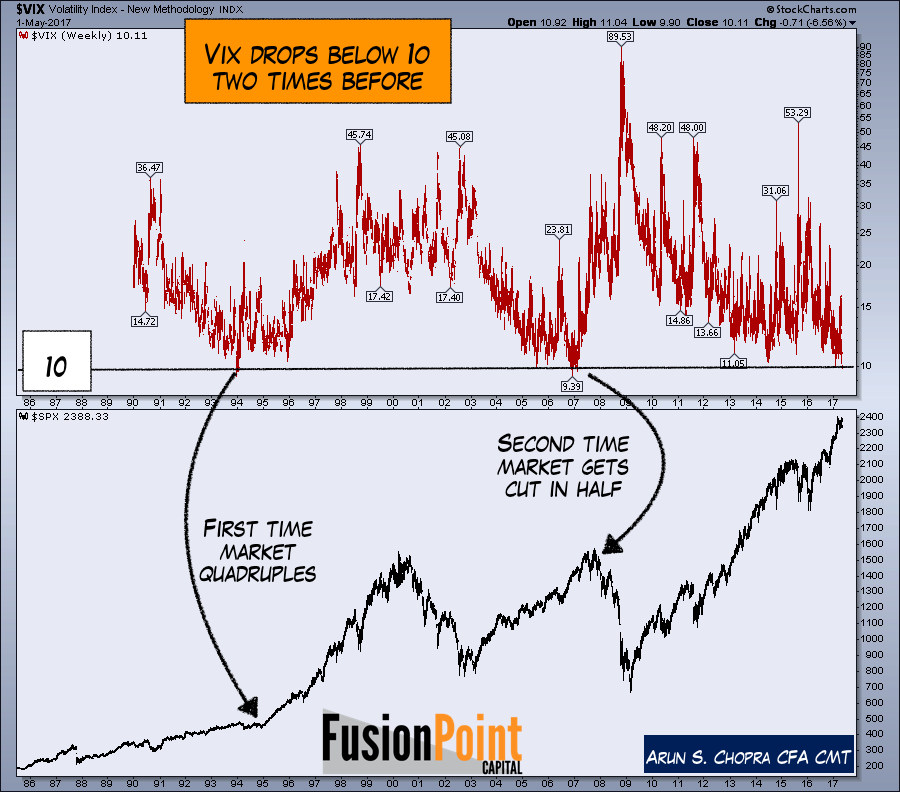
But let's take a look under the hood of each to see if we can get any further info (spoiler...